

Counting the days on a blackboard
Коллекция по умолчанию
Коллекция по умолчанию
Создать новую
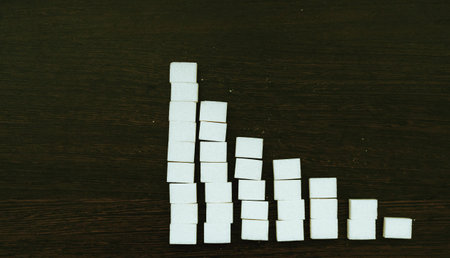
Sugar cubes are stacked in a column in an increasing direction on a dark background. Harmful to health. Diabetes.
Коллекция по умолчанию
Коллекция по умолчанию
Создать новую

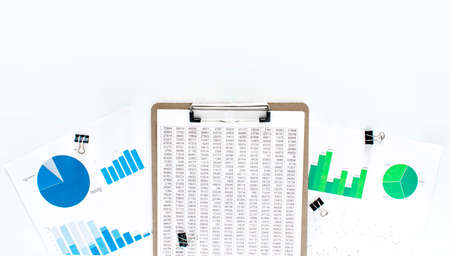
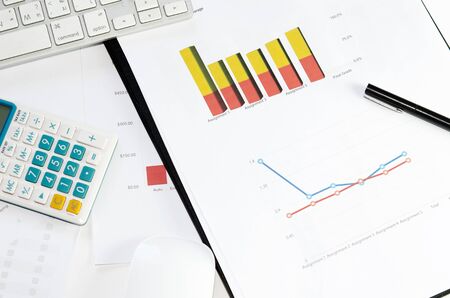
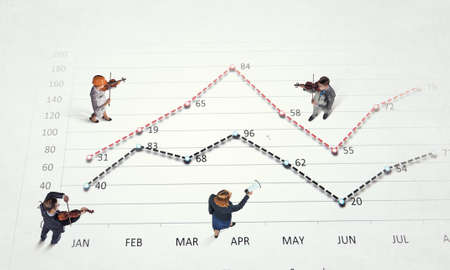
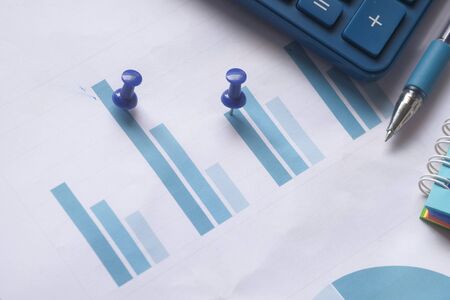
Business concept: pen and finance report over white
Коллекция по умолчанию
Коллекция по умолчанию
Создать новую
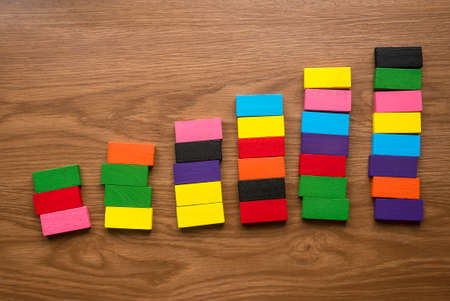
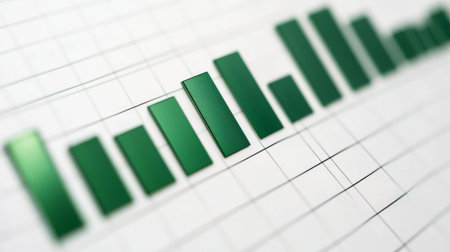
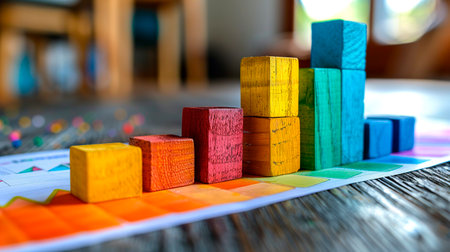
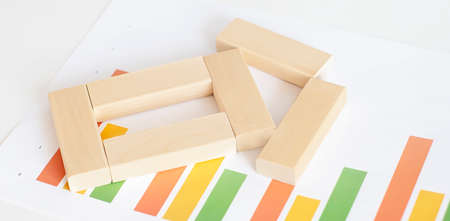
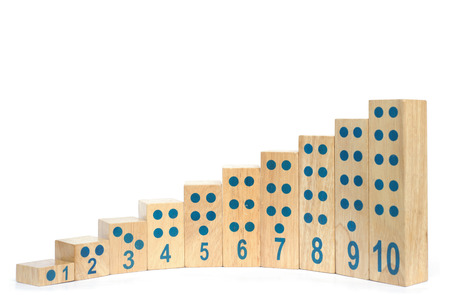
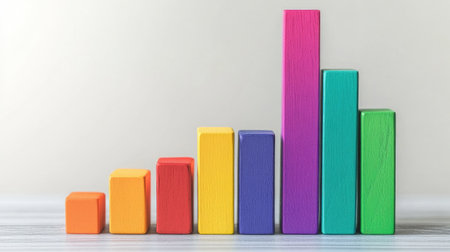
A colorful wooden block with an arrangement of stair or graph.
Коллекция по умолчанию
Коллекция по умолчанию
Создать новую

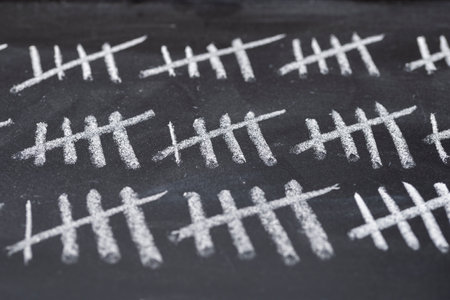
Counting stripes calendar. Handmade tally marks written on the wall by white chalk. Endless pandemic lockdown, longtime prison, waiting for the summer, ancient counting methods concept.
Коллекция по умолчанию
Коллекция по умолчанию
Создать новую
Tally marks handwritten with chalk on a blackboard close up
Коллекция по умолчанию
Коллекция по умолчанию
Создать новую
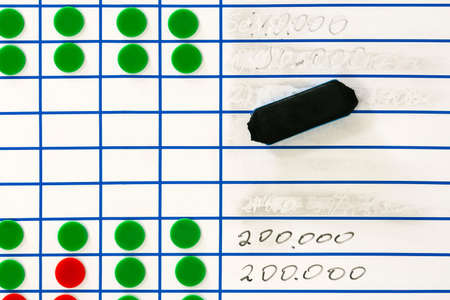
Green and red magnets on flip chart in workshop
Коллекция по умолчанию
Коллекция по умолчанию
Создать новую

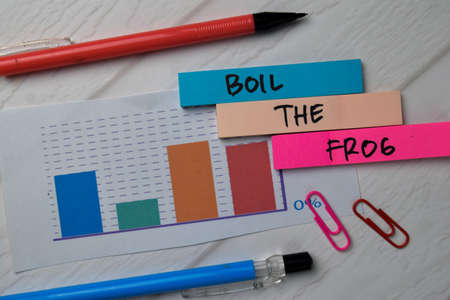
A vibrant bar graph adorned with colorful sticky notes showcases data trends in a modern office setting. The image captures the essence of collaboration and creativity, highlighting the dynamic process of analyzing and presenting information.
Коллекция по умолчанию
Коллекция по умолчанию
Создать новую

Chalk tally chart counting
Коллекция по умолчанию
Коллекция по умолчанию
Создать новую
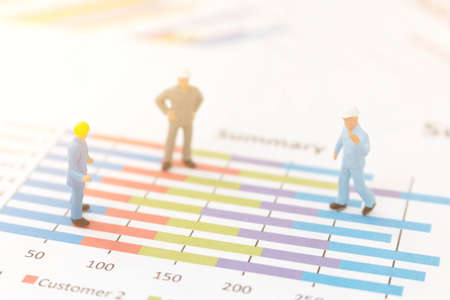
Businessman standing on a graph chart
Коллекция по умолчанию
Коллекция по умолчанию
Создать новую

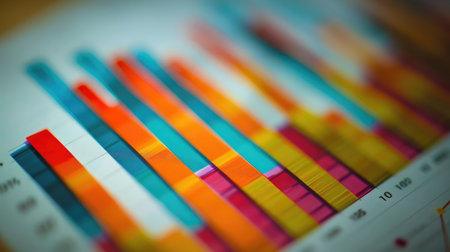
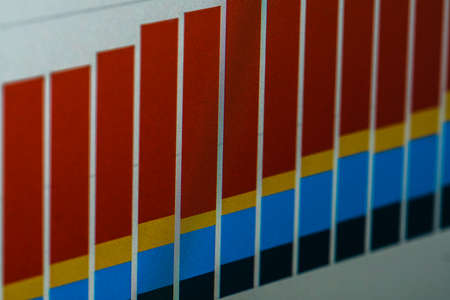
Colored sticker stripes on business analytics chart closeup
Коллекция по умолчанию
Коллекция по умолчанию
Создать новую
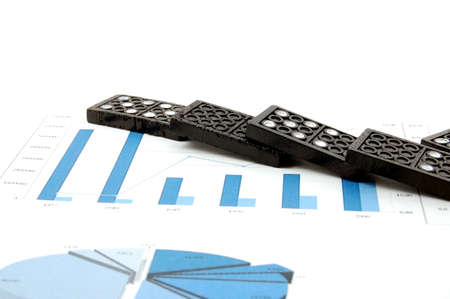
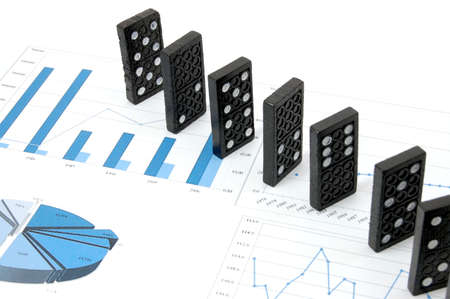
some domino stones on a blue business chart
Коллекция по умолчанию
Коллекция по умолчанию
Создать новую

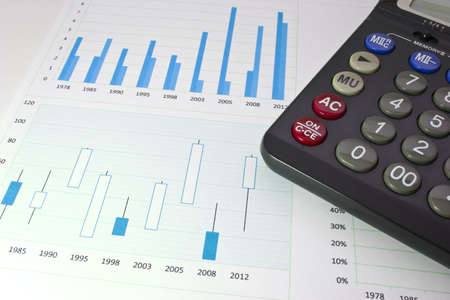
Shallow depth of field (selective focus) with details of a chart showing the stock market crash from March 2020 due to the Covid-19 pandemic on a computer screen (S&P500 index)
Коллекция по умолчанию
Коллекция по умолчанию
Создать новую

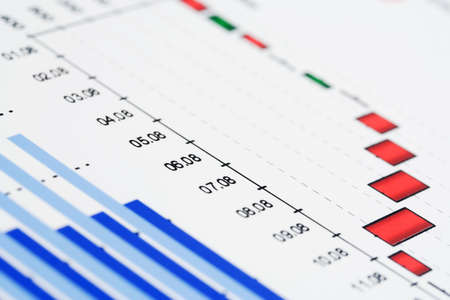
Close-up of a stock market analysis chart with a mix of bar graphs and line graphs highlighting key data
Коллекция по умолчанию
Коллекция по умолчанию
Создать новую

A visually engaging workspace featuring colorful push pins and sticky notes on graph paper, illustrating data representation and enhancing creative organization for projects.
Коллекция по умолчанию
Коллекция по умолчанию
Создать новую
A financial bar chart showing comparison of investment returns, with green bars rising sharply to symbolize growth, displayed against a white background with grid lines.
Коллекция по умолчанию
Коллекция по умолчанию
Создать новую

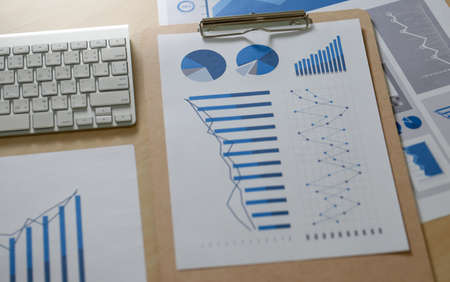
Financial graphs and charts analysis
Коллекция по умолчанию
Коллекция по умолчанию
Создать новую
Business concept. Finance documentation, green and blue diagram on the white background. Yellow paper plate. Ammound, count.
Коллекция по умолчанию
Коллекция по умолчанию
Создать новую
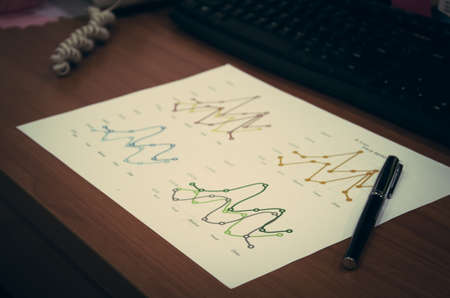
Line graph on desk and pen. Vintage filter
Коллекция по умолчанию
Коллекция по умолчанию
Создать новую
An office worker shows his colleagues a presentation with a company development graph at night on the company's computer
Коллекция по умолчанию
Коллекция по умолчанию
Создать новую
Colorful wooden blocks in a row on the background of a graph
Коллекция по умолчанию
Коллекция по умолчанию
Создать новую

business graph with pen
Коллекция по умолчанию
Коллекция по умолчанию
Создать новую
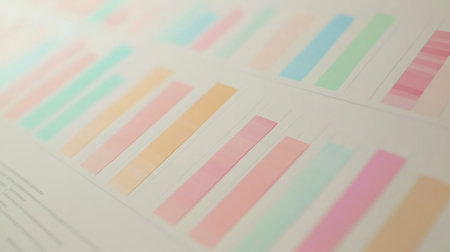
A vibrant display of pastel color swatches arranged on a light background, ideal for exploring color combinations and creative design concepts. Perfect for artists and designers.
Коллекция по умолчанию
Коллекция по умолчанию
Создать новую
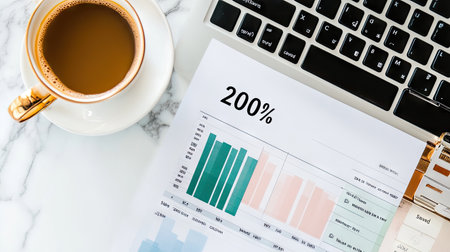
A modern workspace scene featuring a cup of coffee beside a laptop, with charts and graphs showcasing data analysis for productivity and business growth.
Коллекция по умолчанию
Коллекция по умолчанию
Создать новую
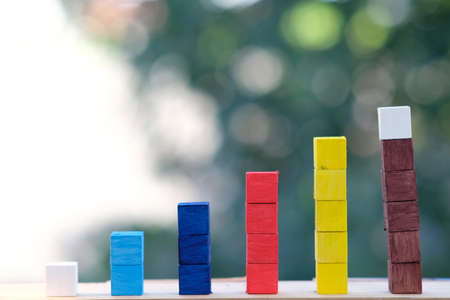
Colorful wooden blocks stacking as step stair. Business growth concept.
Коллекция по умолчанию
Коллекция по умолчанию
Создать новую
A vibrant arrangement of colorful wooden blocks illustrating growth and progress. This image can be used in business, education, or creativity themes.
Коллекция по умолчанию
Коллекция по умолчанию
Создать новую

Voting and Election concept, voting paper in the ballot box 042
Коллекция по умолчанию
Коллекция по умолчанию
Создать новую

Abstract candlestick chart on white digital screen. Stock market or crypto data chart, graph with rectangular grid on light background.
Коллекция по умолчанию
Коллекция по умолчанию
Создать новую

Unleashing Business Growth in 2024: Achieving Sustainable Development through Positive Indicators and Smart Strategies
Коллекция по умолчанию
Коллекция по умолчанию
Создать новую

A pattern of varied multicolored 3d bar charts on small wooden bases, scattered repetitively in varied arrangements on a white background.
Коллекция по умолчанию
Коллекция по умолчанию
Создать новую

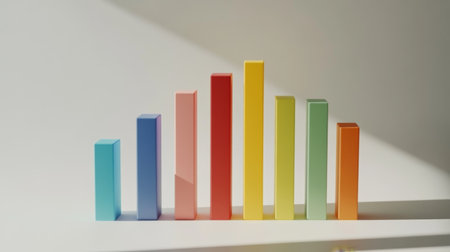
3d render graph over gray background, rainbow business infographic, panoramic layout
Коллекция по умолчанию
Коллекция по умолчанию
Создать новую

Counting by tally chart drawn in chalk on a blackboard
Коллекция по умолчанию
Коллекция по умолчанию
Создать новую
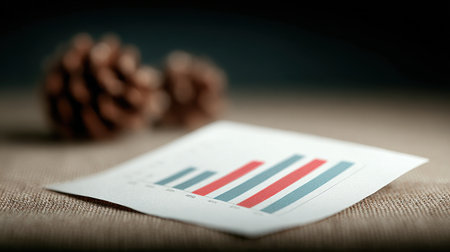
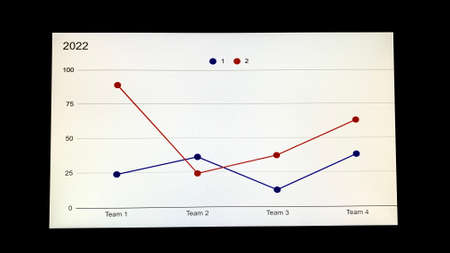
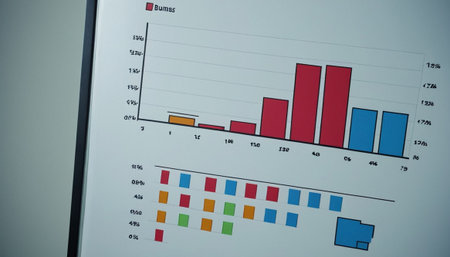
A piece of paper with a graph on it is on a table. The graph is a bar chart with a red and blue line. The paper is crumpled and has a few creases
Коллекция по умолчанию
Коллекция по умолчанию
Создать новую
Graphs and charts on the table, business and finance concept.
Коллекция по умолчанию
Коллекция по умолчанию
Создать новую

ballpoint pen indicates income graphs lying on the table
Коллекция по умолчанию
Коллекция по умолчанию
Создать новую

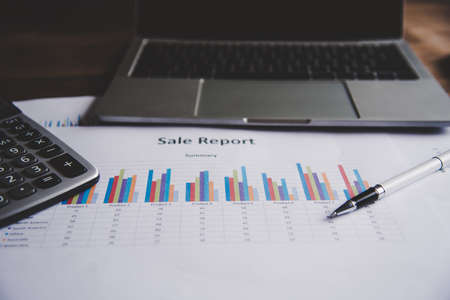
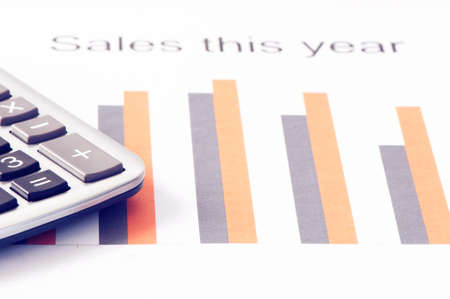
Close-up photo of sale statistic report document at office table
Коллекция по умолчанию
Коллекция по умолчанию
Создать новую

graphic elements ascending, scale, drawn by hand on blue window glass, doodle three columns, pedestal,
Коллекция по умолчанию
Коллекция по умолчанию
Создать новую
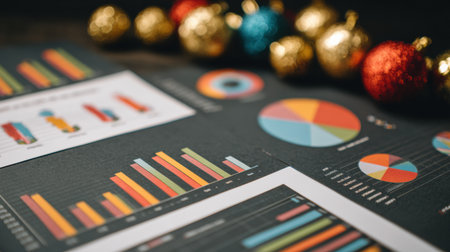
Charts and graphs display data insights on a table, while vibrant holiday ornaments add a festive touch to the workspace, creating a cheerful atmosphere.
Коллекция по умолчанию
Коллекция по умолчанию
Создать новую

This vibrant image showcases colorful paper cutouts arranged strategically on a dark background, symbolizing project planning and workflow processes.
Коллекция по умолчанию
Коллекция по умолчанию
Создать новую
Stock market graphs and charts.
Коллекция по умолчанию
Коллекция по умолчанию
Создать новую

Colored sticks in the form of a graph of profit against the background of the color of sea water.
Коллекция по умолчанию
Коллекция по умолчанию
Создать новую

Analysis of data from graphs. select focus.
Коллекция по умолчанию
Коллекция по умолчанию
Создать новую

Stacked bar chart on a table in front of a computer monitor
Коллекция по умолчанию
Коллекция по умолчанию
Создать новую
Stock market business graph chart on digital screen
Коллекция по умолчанию
Коллекция по умолчанию
Создать новую
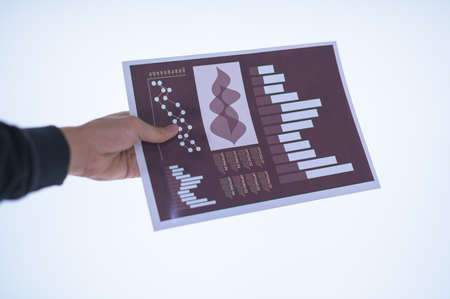
Businessman hand holding a document. Scenes white background.
Коллекция по умолчанию
Коллекция по умолчанию
Создать новую

Blank Note I can do it with pen on orange colour background for your planning and note text.
Коллекция по умолчанию
Коллекция по умолчанию
Создать новую
A close-up of a business report with colorful bar and line graphs.
Коллекция по умолчанию
Коллекция по умолчанию
Создать новую
Data Analysis Chart And Graphs placed on the desk in the office. Business Analysis and Planning Concept
Коллекция по умолчанию
Коллекция по умолчанию
Создать новую

Stock market or forex trading graph in graphic concept suitable for financial investment or Economic trends business idea and all art work design.
Коллекция по умолчанию
Коллекция по умолчанию
Создать новую
Monthly percentage bar chart showing financial comparison of 2026 budget versus actual performance data displayed on digital screen. Results tracking.
Коллекция по умолчанию
Коллекция по умолчанию
Создать новую

business analysis and statistics concept, desk with mixed graphs and charts on clipboard
Коллекция по умолчанию
Коллекция по умолчанию
Создать новую
A business growth chart displayed on a wooden table represents data analysis and strategic planning. Ideal for finance and marketing themes.
Коллекция по умолчанию
Коллекция по умолчанию
Создать новую
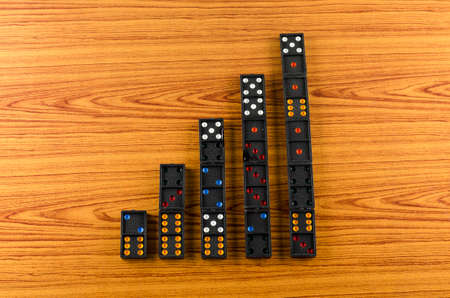
black domino on wooden background
Коллекция по умолчанию
Коллекция по умолчанию
Создать новую

Blue and pink cubes. The concept of sexism, feminism and equality. Soft focus
Коллекция по умолчанию
Коллекция по умолчанию
Создать новую

Blank Canvas of May: Embracing Spring's Hypnotic Day 6
Коллекция по умолчанию
Коллекция по умолчанию
Создать новую

Business report financial statistics documents and infographics at office table closeup / Sales report marketing concept
Коллекция по умолчанию
Коллекция по умолчанию
Создать новую
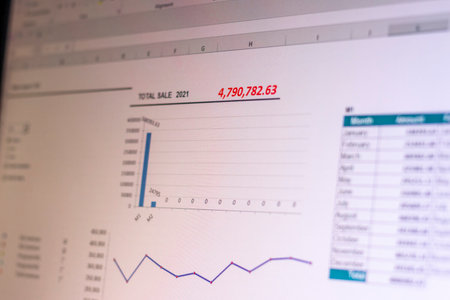
Shot of an excel sheet on computer screen showing sales report with charts and tables
Коллекция по умолчанию
Коллекция по умолчанию
Создать новую

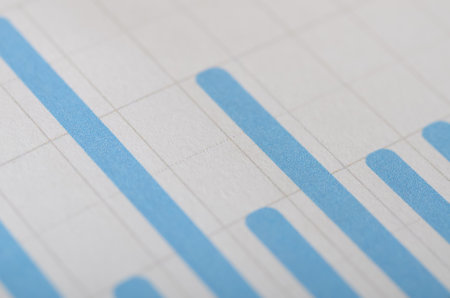
Graphs and Charts. Flowcharts. Statistic. Macro. Blue color.
Коллекция по умолчанию
Коллекция по умолчанию
Создать новую
Short Term text on sticky notes isolated on office desk
Коллекция по умолчанию
Коллекция по умолчанию
Создать новую

Businessmen miniature figure standing on investment and profit graph for analysis and discussion.
Коллекция по умолчанию
Коллекция по умолчанию
Создать новую
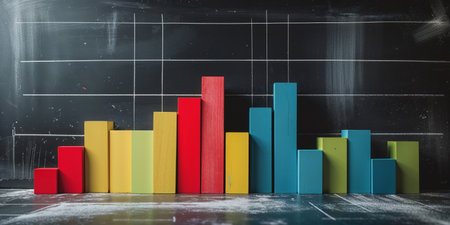
AI Generated. Colorful wooden blocks arranged in bar graph on blackboard surface
Коллекция по умолчанию
Коллекция по умолчанию
Создать новую
Close-up of a chart with numbers
Коллекция по умолчанию
Коллекция по умолчанию
Создать новую

Team work with results and reports
Коллекция по умолчанию
Коллекция по умолчанию
Создать новую

Crucial Elements: Insights on a Grey Canvas - Symbolism of Notebook, Pen, Calculator, and Chart in AR 3:2
Коллекция по умолчанию
Коллекция по умолчанию
Создать новую

Stable financial growth wooden bar chart showing rising blue columns on white background
Коллекция по умолчанию
Коллекция по умолчанию
Создать новую
some domino stones on a blue business chart
Коллекция по умолчанию
Коллекция по умолчанию
Создать новую
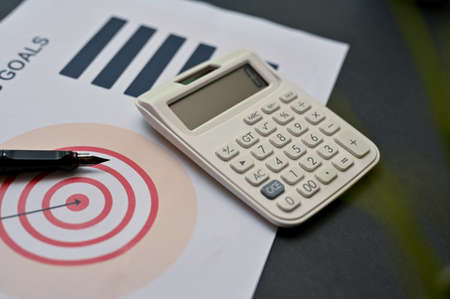
Business workspace top view with calculator, pen and business goals planning report. Close-up image
Коллекция по умолчанию
Коллекция по умолчанию
Создать новую

Graph composed of branches and pine cones. Natural growth chart with an upward trend line. Sustainable business and ecological development concept.
Коллекция по умолчанию
Коллекция по умолчанию
Создать новую

Graphs and Charts. Flowcharts. Statistic. Macro. Blue color.
Коллекция по умолчанию
Коллекция по умолчанию
Создать новую

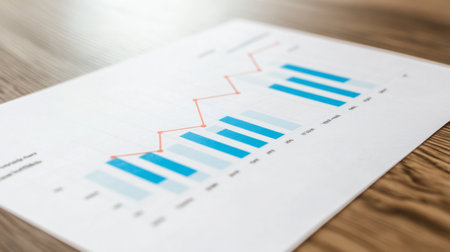
Sales growth and development illustrated on a graph
Коллекция по умолчанию
Коллекция по умолчанию
Создать новую

Closeup of a woman's hand marking a date on a calendar
Коллекция по умолчанию
Коллекция по умолчанию
Создать новую
Wooden block toy isolated over chart background.
Коллекция по умолчанию
Коллекция по умолчанию
Создать новую
Coronavirus virus covid-19 chart, crisis, economy down, 2019-ncov graph epidemic
Коллекция по умолчанию
Коллекция по умолчанию
Создать новую

close up of a finance graph on an office desk
Коллекция по умолчанию
Коллекция по умолчанию
Создать новую
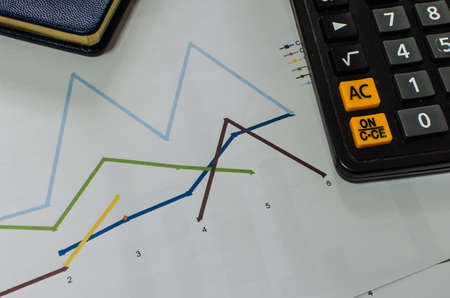
Financial graphs with calculator
Коллекция по умолчанию
Коллекция по умолчанию
Создать новую
Close-Up of Bar Graph with Blue Bars on a Data Report
Коллекция по умолчанию
Коллекция по умолчанию
Создать новую
financial charts and graphs on the table of the businessman, business concept
Коллекция по умолчанию
Коллекция по умолчанию
Создать новую

financial graph, calculator and notepad on table
Коллекция по умолчанию
Коллекция по умолчанию
Создать новую
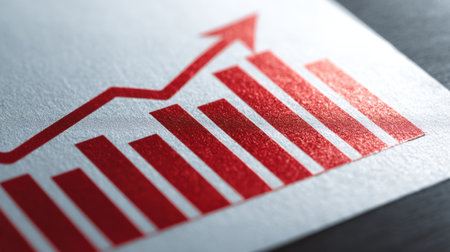
A close-up view of a red growth chart on a paper surface, symbolizing financial success and progress in business strategy and investment opportunities.
Коллекция по умолчанию
Коллекция по умолчанию
Создать новую
Business paperwork present with diagram.
Коллекция по умолчанию
Коллекция по умолчанию
Создать новую
Wooden blocks with number isolated
Коллекция по умолчанию
Коллекция по умолчанию
Создать новую

diagram pointing down. decline drop reduction concept. exponential curve on dark blue backdrop.
Коллекция по умолчанию
Коллекция по умолчанию
Создать новую

Businesswoman holding a notepad at her desk, a group of businessmen attending a meeting and holding meeting materials, brainstorming meeting to plan a company's growth. Business meeting idea.
Коллекция по умолчанию
Коллекция по умолчанию
Создать новую
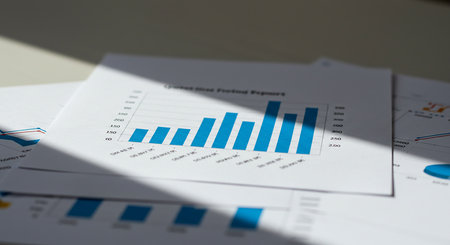
Business reports Teamwork on table report of documents Blue graphs and charts financial paperwork and reports
Коллекция по умолчанию
Коллекция по умолчанию
Создать новую

Notebook work with statistics on the table
Коллекция по умолчанию
Коллекция по умолчанию
Создать новую
Detailed view of a table covered in rows of numbers and formulas, A spreadsheet filled with rows of numbers and formulas
Коллекция по умолчанию
Коллекция по умолчанию
Создать новую
A close-up view of a colorful bar graph showing data analysis. This visual insight illustrates trends and performance metrics useful for business and finance.
Коллекция по умолчанию
Коллекция по умолчанию
Создать новую

Miniature people standing on colorful wooden blocks with copy space for text
Коллекция по умолчанию
Коллекция по умолчанию
Создать новую
A detailed bar graph display featuring colorful sticky notes that illustrates data analytics in a modern office setting, symbolizing creativity and strategic planning.
Коллекция по умолчанию
Коллекция по умолчанию
Создать новую

Business girl holding growth graph. Business development concept
Коллекция по умолчанию
Коллекция по умолчанию
Создать новую
A colorful bar chart showing quarterly sales growth for a tech startup, with upward trends highlighted
Коллекция по умолчанию
Коллекция по умолчанию
Создать новую
Creative bar graph made from colorful blocks, set against a white minimalist background
Коллекция по умолчанию
Коллекция по умолчанию
Создать новую

Calculator, glasses, magnifier and pen with stock investment graph.
Коллекция по умолчанию
Коллекция по умолчанию
Создать новую
Top view of business people and graphs and diagrams on floor
Коллекция по умолчанию
Коллекция по умолчанию
Создать новую
financial report with pen and calculator at the office
Коллекция по умолчанию
Коллекция по умолчанию
Создать новую
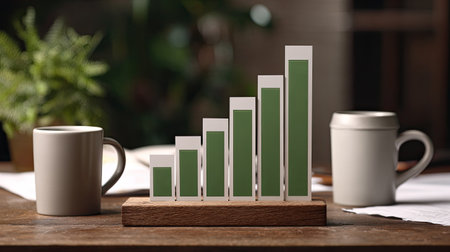
A bar graph depicts upward growth beside coffee mugs and a plant.
Коллекция по умолчанию
Коллекция по умолчанию
Создать новую
Precise and detailed mesh design in a cartoon style. Simplified blue color scheme for a clean look. Ideal for organizing projects or creating schedules. Great for planning and making plans.
Коллекция по умолчанию
Коллекция по умолчанию
Создать новую
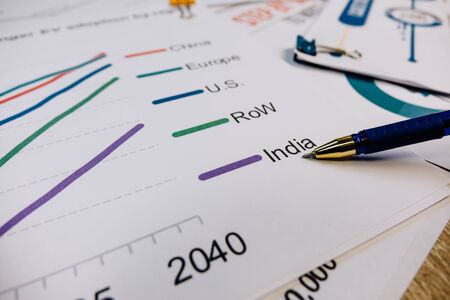
the pen points to the chart layer with the word India.
Коллекция по умолчанию
Коллекция по умолчанию
Создать новую
close up of financial charts, calculator and tea on table
Коллекция по умолчанию
Коллекция по умолчанию
Создать новую
Calculator and chart
Коллекция по умолчанию
Коллекция по умолчанию
Создать новую
Legion-Media
Создайте свои проекты на основе качественных стоковых фотографий и видео.


Copyright © Legion-Media.