
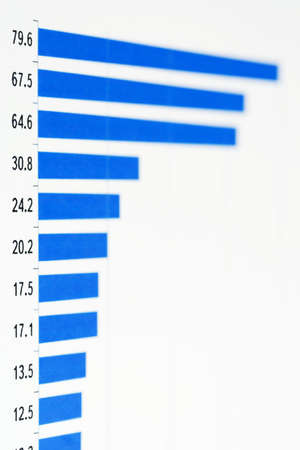
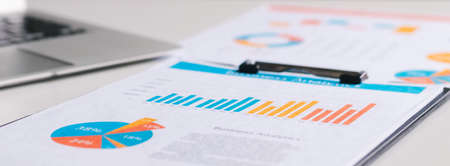
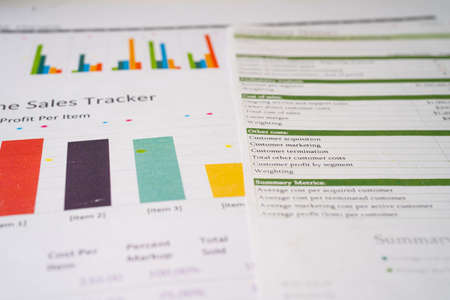
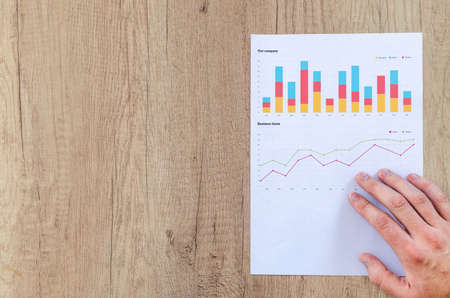
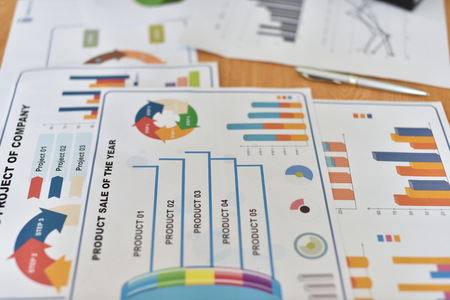
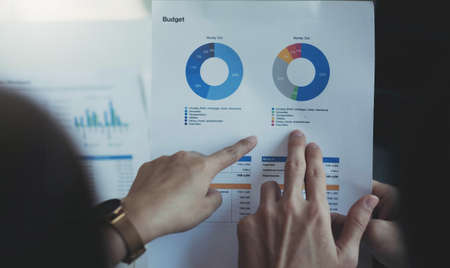
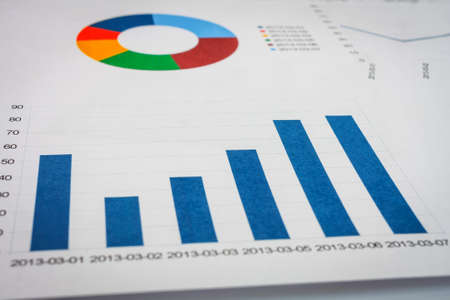
close-up business graph paper on working table
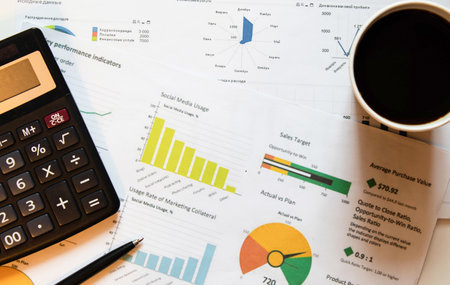
Коллекция по умолчанию
Коллекция по умолчанию
Создать новую
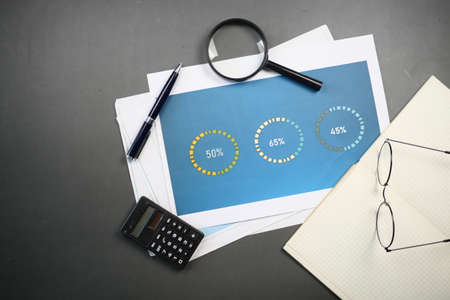
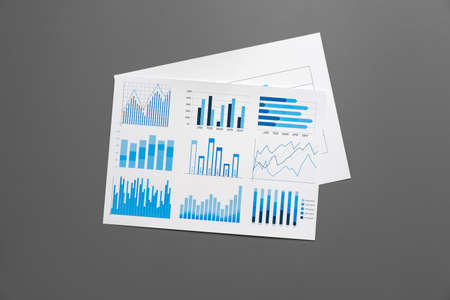
Business document paper placed on a white scene
Коллекция по умолчанию
Коллекция по умолчанию
Создать новую

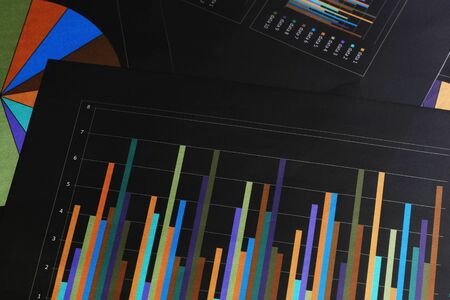
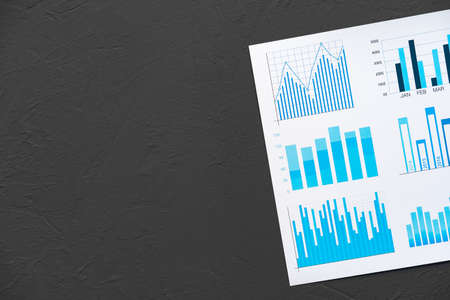
Printed graphs and laptop on dark gray surface
Коллекция по умолчанию
Коллекция по умолчанию
Создать новую
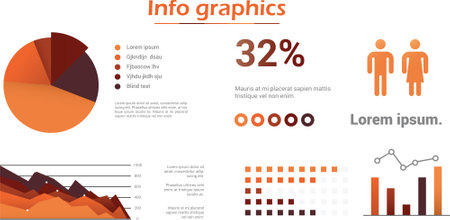
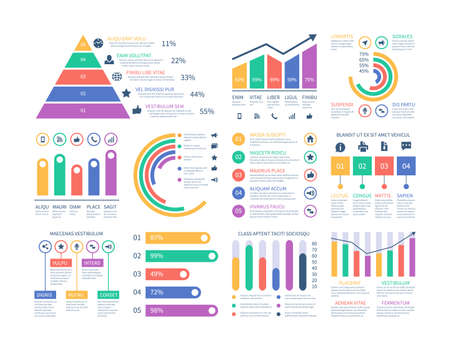
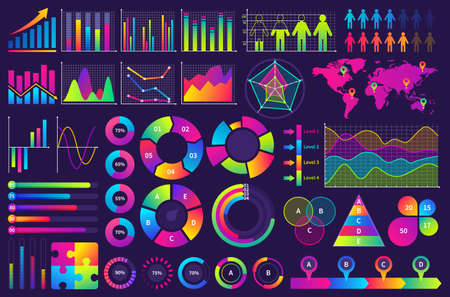
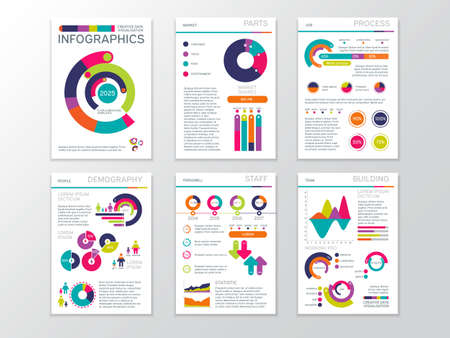
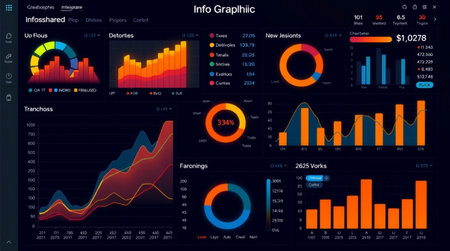
Set of infographics with diverse diagrams and formulas on a white background
Коллекция по умолчанию
Коллекция по умолчанию
Создать новую
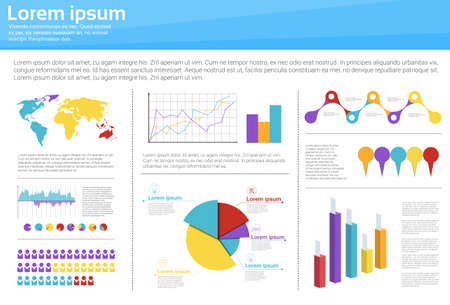
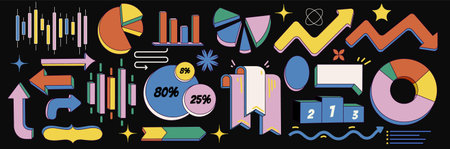
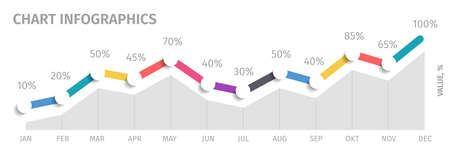
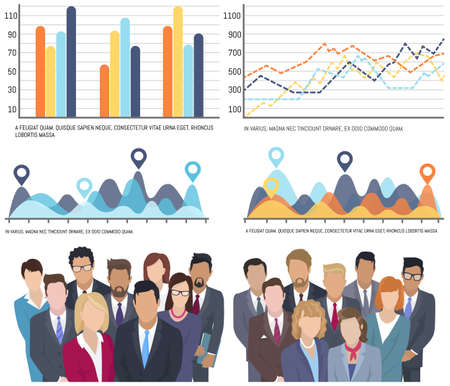
Graph Set Finance Diagram Infographic Icon Financial Business Chart Flat Vector Illustration
Коллекция по умолчанию
Коллекция по умолчанию
Создать новую

Modern office workplace with laptop computer mockup, tablet pc and smartphone on the office desk. There is a laptop, tablet computer, smartphone on the table. For design presentation or portfolio.
Коллекция по умолчанию
Коллекция по умолчанию
Создать новую
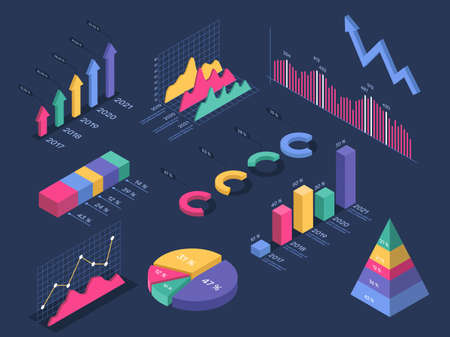
Isometric infographics. Pie chart, circle graph, histogram, pyramid diagram, growth progress bar. 3d infographic charts for presentation vector set. Data icons for business plan analytics
Коллекция по умолчанию
Коллекция по умолчанию
Создать новую

reports and histograms on paper on the table, analytics and statistics on paper, business analytics
Коллекция по умолчанию
Коллекция по умолчанию
Создать новую
financial graph, calculator and notepad on table
Коллекция по умолчанию
Коллекция по умолчанию
Создать новую
Business themed presentation templates. Background with papers full of graphs and executive glasses. Folder with papers full of graphs and glasses on a table. High quality photo
Коллекция по умолчанию
Коллекция по умолчанию
Создать новую
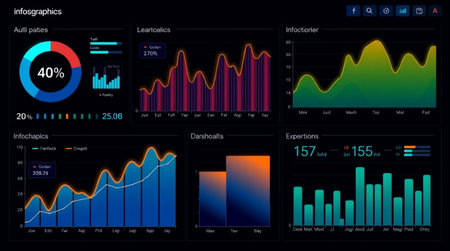
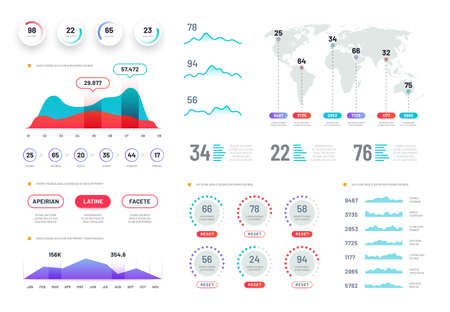
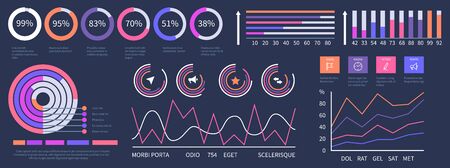
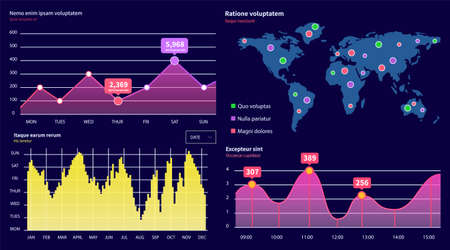
Futuristic infographics design elements for business presentations, annual reports and web design.
Коллекция по умолчанию
Коллекция по умолчанию
Создать новую
Image of statistics recording and covid 19 cells over man drawing in office wearing face mask. global covid 19 pandemic, health and medicine concept digitally generated image.
Коллекция по умолчанию
Коллекция по умолчанию
Создать новую
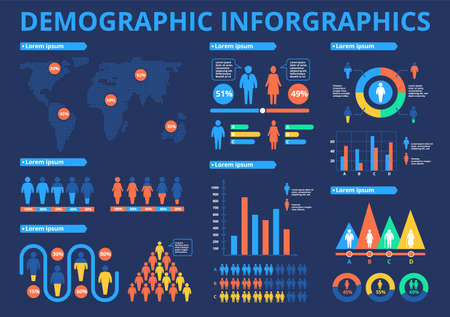
Demographics infographic. World map population statistic with data charts, graphs, diagrams, people icons. Human infographics Vector brochure. Young and old, female and male human beings
Коллекция по умолчанию
Коллекция по умолчанию
Создать новую
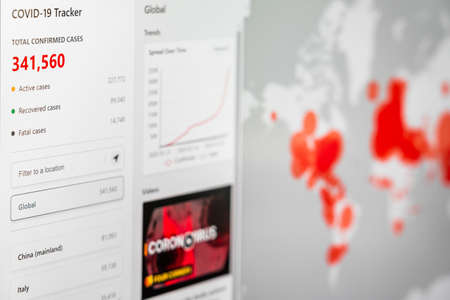
BUCHAREST, ROMANIA - MARCH 23, 2020: Coronavirus Total Cases Of The Pandemic Spreading All Around The Globe In March
Коллекция по умолчанию
Коллекция по умолчанию
Создать новую
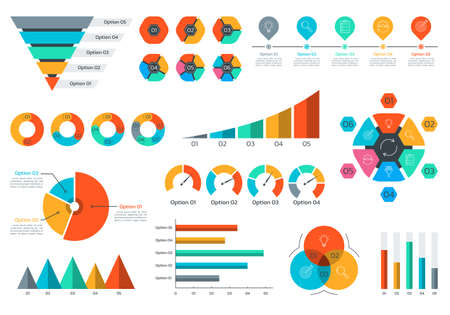
Chart and graph set. Business data infographic elements with circle diagram, pie chart, funnel, timeline infographics. Vector illustration.
Коллекция по умолчанию
Коллекция по умолчанию
Создать новую

Glasses and phone lie on a black background next to a gray notepad and a sheet with a schedule
Коллекция по умолчанию
Коллекция по умолчанию
Создать новую
Close up of business graph analysis document
Коллекция по умолчанию
Коллекция по умолчанию
Создать новую
Printed graphs and laptop on dark gray surface
Коллекция по умолчанию
Коллекция по умолчанию
Создать новую
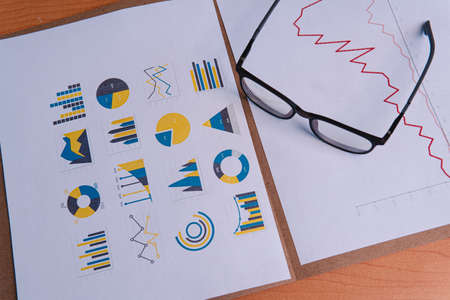
Documents with colourful charts, graphs and diagrams
Коллекция по умолчанию
Коллекция по умолчанию
Создать новую

reports and histograms on paper on the table, analytics and statistics on paper, business analytics
Коллекция по умолчанию
Коллекция по умолчанию
Создать новую
Analytics infographics elements. Data graphic, marketing chart diagram. Budget flat histogram. Statistic infographics elements. Illustration of visualization diagram, infographic statistic flowchart
Коллекция по умолчанию
Коллекция по умолчанию
Создать новую
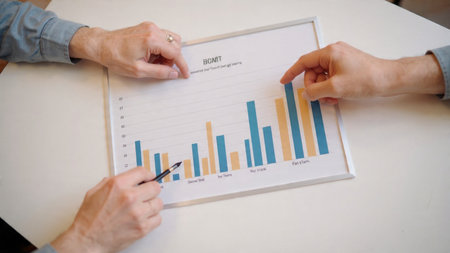
People take view business growth graphs
Коллекция по умолчанию
Коллекция по умолчанию
Создать новую

Man showing business graph on wooden table
Коллекция по умолчанию
Коллекция по умолчанию
Создать новую
Graph charts business collection of glowing colorful diagrams, vector illustrations set for infographic. Infocharts, bars, pie statistics.
Коллекция по умолчанию
Коллекция по умолчанию
Создать новую
Data financial instruments chart, downtrend stock market analysis report
Коллекция по умолчанию
Коллекция по умолчанию
Создать новую

Image of data processing over diverse schoolchildren having image call. Global education and digital interface concept digitally generated image.
Коллекция по умолчанию
Коллекция по умолчанию
Создать новую
Above view flat lay of business data charts and office supplies over coral background, copy space
Коллекция по умолчанию
Коллекция по умолчанию
Создать новую
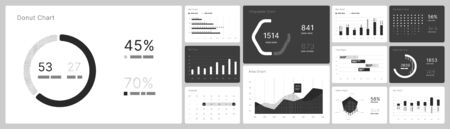
Modern business presentation documents with graphics and infographic charts. Corporate marketing vector template brochure pages. Documents with color graphic for presentation illustration
Коллекция по умолчанию
Коллекция по умолчанию
Создать новую

Business finance person is reviewing a company's financial documents prepared by the Finance Department for a meeting with business partners. Concept of validating the accuracy of financial numbers.
Коллекция по умолчанию
Коллекция по умолчанию
Создать новую
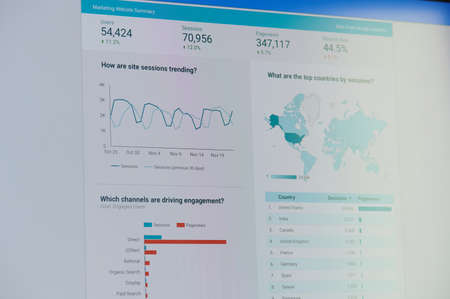
New york, USA - November 24, 2020: Google ads marketing website summarydashboard on laptop screen
Коллекция по умолчанию
Коллекция по умолчанию
Создать новую
Business data market elements. Pie, Line, Candlestick Chart. Charts and graphs. Planning and visualization of statistics. Isolated Design in 2d flat cartoon style for web, social media, print
Коллекция по умолчанию
Коллекция по умолчанию
Создать новую

Business performance analysis. Business Graphs with Keyboard, pen.
Коллекция по умолчанию
Коллекция по умолчанию
Создать новую
graph chart of stock market investment trading.
Коллекция по умолчанию
Коллекция по умолчанию
Создать новую

Our profits are on the rise. Shot of paperwork and stationery on a desk in an empty office during the day.
Коллекция по умолчанию
Коллекция по умолчанию
Создать новую
Charts Graphs spreadsheet paper. Financial development, Banking Account, Statistics, Investment Analytic research data economy, Stock exchange Business office company meeting concept.
Коллекция по умолчанию
Коллекция по умолчанию
Создать новую
Office workplace table with report pages with financial data
Коллекция по умолчанию
Коллекция по умолчанию
Создать новую

Office desk table with laptop, supplies and financial reports. Top view with copy space
Коллекция по умолчанию
Коллекция по умолчанию
Создать новую
Charts and graphs on A4 page view from above
Коллекция по умолчанию
Коллекция по умолчанию
Создать новую

Image of data processing over landscape. Global digital interface technology and connections concept digitally generated image.
Коллекция по умолчанию
Коллекция по умолчанию
Создать новую
Financial paper with charts and diagrams on gray table
Коллекция по умолчанию
Коллекция по умолчанию
Создать новую
Financial paper with charts and diagrams on gray table
Коллекция по умолчанию
Коллекция по умолчанию
Создать новую
Business graphs background.
Коллекция по умолчанию
Коллекция по умолчанию
Создать новую
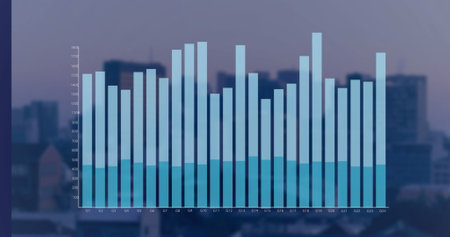
Image of moving columns over data processing on black background. Global connections and data processing concept digitally generated image.
Коллекция по умолчанию
Коллекция по умолчанию
Создать новую

close up of pin and hand drawn business strategy graph chart on sticky note with cork board as concept
Коллекция по умолчанию
Коллекция по умолчанию
Создать новую
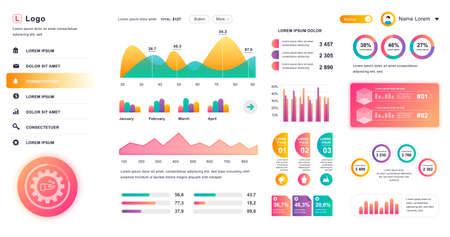
Futuristic user interface with infographics elements. UI UX GUI design.
Коллекция по умолчанию
Коллекция по умолчанию
Создать новую
Visionary business dashboard for financial data analysis . 3D rendering computer graphic .
Коллекция по умолчанию
Коллекция по умолчанию
Создать новую

chart or graph paper. Financial, account, statistics and business data concept.
Коллекция по умолчанию
Коллекция по умолчанию
Создать новую
analyzing company's financial balance sheet working with digital augmented reality graphics. Businessman calculates financial data for long-term investment.
Коллекция по умолчанию
Коллекция по умолчанию
Создать новую

Business graph analysis documents on gray background
Коллекция по умолчанию
Коллекция по умолчанию
Создать новую

Image of coronavirus Covid 19 cells with red graph statistics recording and data processing on white background. Coronavirus Covid 19 spreading pandemic concept digitally generated image.
Коллекция по умолчанию
Коллекция по умолчанию
Создать новую
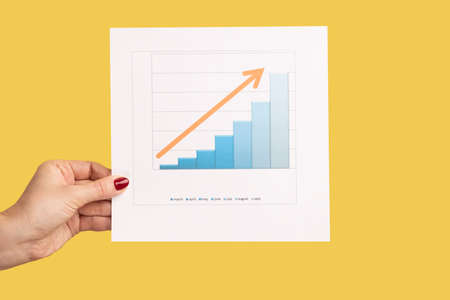
Closeup side view of woman hand holding analyzing graphs and diagrams, statistic. Indoor studio shot isolated on yellow background.
Коллекция по умолчанию
Коллекция по умолчанию
Создать новую

Image of statistics and financial data processing over purple background. Global business, finances, computing and data processing concept digitally generated image.
Коллекция по умолчанию
Коллекция по умолчанию
Создать новую
Dashboard UI. Admin panel vector design template with infographic elements, HUD diagram, info graphics. Website dashboard for UI and UX design web page. Vector illustration.
Коллекция по умолчанию
Коллекция по умолчанию
Создать новую
Dashboard graphs. Hud info screen, futuristic interactive interface with charts and diagrams. Abstract infographics vector template. Interface and infographic, infochart presentation illustration
Коллекция по умолчанию
Коллекция по умолчанию
Создать новую
An office worker shows his colleagues a presentation with a company development graph at night on the company's computer
Коллекция по умолчанию
Коллекция по умолчанию
Создать новую

Image of financial data processing over laptop and tablet on desk. digital interface, global finance and business concept digitally generated image.
Коллекция по умолчанию
Коллекция по умолчанию
Создать новую
Charts Graphs paper. Financial development, Banking Account, Statistics, Investment Analytic research data economy, Stock exchange Business office company meeting concept.
Коллекция по умолчанию
Коллекция по умолчанию
Создать новую

Analysis of data from graphs. select focus.
Коллекция по умолчанию
Коллекция по умолчанию
Создать новую
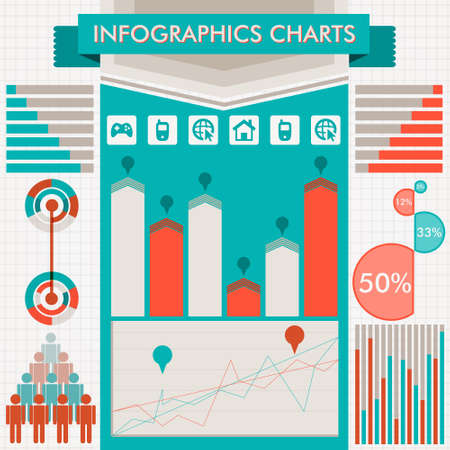
retro infographics set world map
Коллекция по умолчанию
Коллекция по умолчанию
Создать новую

business man work chart schedule or planning financial report data methodology
Коллекция по умолчанию
Коллекция по умолчанию
Создать новую

Close up of business graph analysis document
Коллекция по умолчанию
Коллекция по умолчанию
Создать новую
Financial paper with charts and diagrams on gray table
Коллекция по умолчанию
Коллекция по умолчанию
Создать новую
Working, analyzing graphics with the tablet and doing calculations
Коллекция по умолчанию
Коллекция по умолчанию
Создать новую

business analysis and statistics concept, desk with mixed graphs and charts on clipboard
Коллекция по умолчанию
Коллекция по умолчанию
Создать новую
Work table of a businessman with papers, graphs and glasses. Business presentation template with papers, folder and a chair in the background. High quality photo
Коллекция по умолчанию
Коллекция по умолчанию
Создать новую
Image of interface with statistical data processing against empty office. Computer interface and business data technology concept
Коллекция по умолчанию
Коллекция по умолчанию
Создать новую
Line graph template. Vector illustration for workflow layout, diagram, number options, web design. Vector business infographic template for report, presentation in trendy pastel colors
Коллекция по умолчанию
Коллекция по умолчанию
Создать новую

responsibility and cooperation of the working team Business cash, business concept
Коллекция по умолчанию
Коллекция по умолчанию
Создать новую
Infographic elements in white and black colors. Use in presentation templates, flyer, leaflet and corporate report. UI and UX Kit with big data visualization.
Коллекция по умолчанию
Коллекция по умолчанию
Создать новую
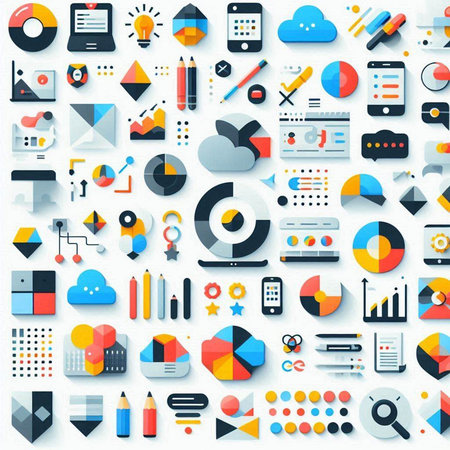
Flat design modern vector illustration icons set of infographics elements.
Коллекция по умолчанию
Коллекция по умолчанию
Создать новую

Statistical financial graph predicting an economic depression after a 2020 global coronavirus pandemic.
Коллекция по умолчанию
Коллекция по умолчанию
Создать новую
Infographic dashboard. Vector interface presentation elements set. Illustration of dashboard interface presentation, infographic and statistic
Коллекция по умолчанию
Коллекция по умолчанию
Создать новую
blue-violet vector HUD set in trend colors for design and device applications
Коллекция по умолчанию
Коллекция по умолчанию
Создать новую
A laptop full of economic curve charts sits beside organized documents and steaming coffee.
Коллекция по умолчанию
Коллекция по умолчанию
Создать новую
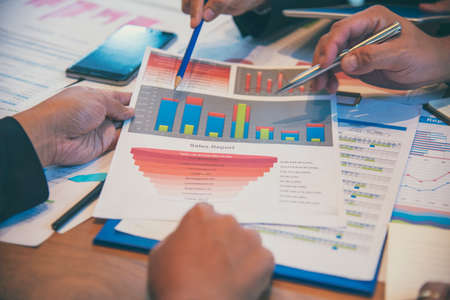
Group of business people meeting in conference room brainstorming consult business document graph chart office desk. Diversity multiethnic group of business people brainstorming and working together.
Коллекция по умолчанию
Коллекция по умолчанию
Создать новую

Data graph, retro futuristic visualisation of diagrams and finance graphics, AI generative
Коллекция по умолчанию
Коллекция по умолчанию
Создать новую
Business infographics set with different diagram. Data visualization elements, marketing charts and graphs. Website and presentation template. Abstract infographics data template. Vector illustration
Коллекция по умолчанию
Коллекция по умолчанию
Создать новую
Successful business project presentation, company strategy planning, statistics indicators analysis. Analytics business information. Presenting company financial report. Presentation of start up data
Коллекция по умолчанию
Коллекция по умолчанию
Создать новую

Professional discussing budget pie chart and financial data in a business setting.
Коллекция по умолчанию
Коллекция по умолчанию
Создать новую
Man showing business graph on wooden table
Коллекция по умолчанию
Коллекция по умолчанию
Создать новую
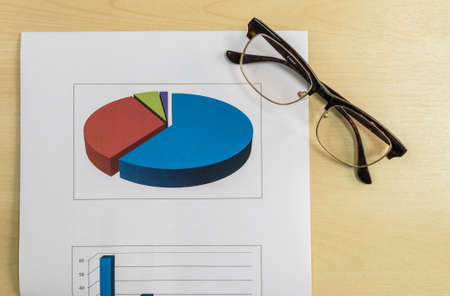
Graph of market share with glasses in business concept
Коллекция по умолчанию
Коллекция по умолчанию
Создать новую
Infographic chart vector template. Annual statistics curve graph design. Market data diagrams. Graphic information visualization and analysis. Statistical indicators and frequency of data changes
Коллекция по умолчанию
Коллекция по умолчанию
Создать новую
Image of financial data processing over a garbage dump. Digitalinterface global finance and business concept digitally generated image.
Коллекция по умолчанию
Коллекция по умолчанию
Создать новую

A statistical report with a diagram lies on the table
Коллекция по умолчанию
Коллекция по умолчанию
Создать новую
Financial accounting stock market graphs analysis. concept
Коллекция по умолчанию
Коллекция по умолчанию
Создать новую
Top view of printed diagrams on paper lying on table
Коллекция по умолчанию
Коллекция по умолчанию
Создать новую
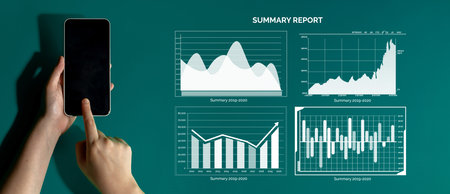
A smartphone held by a hand points at graphs and charts representing a summary report on a teal background, ideal for business analysis and presentation needs.
Коллекция по умолчанию
Коллекция по умолчанию
Создать новую
The various visualisation at trading environment - 3d rendering
Коллекция по умолчанию
Коллекция по умолчанию
Создать новую
Business document Financial chart and graph.
Коллекция по умолчанию
Коллекция по умолчанию
Создать новую
Stock market or forex trading red chart suitable for financial investment concept. Economy trend background for business idea. Stock market tickers with graphs charts and diagram.
Коллекция по умолчанию
Коллекция по умолчанию
Создать новую
Top view of table with financial papers and calculator
Коллекция по умолчанию
Коллекция по умолчанию
Создать новую
Futuristic infographics elements, charts and graphs. Vector illustration
Коллекция по умолчанию
Коллекция по умолчанию
Создать новую
Businessman hand holding a document. Scenes white background.
Коллекция по умолчанию
Коллекция по умолчанию
Создать новую
The paper reports the results of business operations. Close up of business documents on the table. Business man with a chart, Business vision.
Коллекция по умолчанию
Коллекция по умолчанию
Создать новую
Futuristic infographics on a touch screen tablet with charts and graphs
Коллекция по умолчанию
Коллекция по умолчанию
Создать новую
Fund managers team consultation and discuss about analysis Investment stock market by digital tablet.
Коллекция по умолчанию
Коллекция по умолчанию
Создать новую
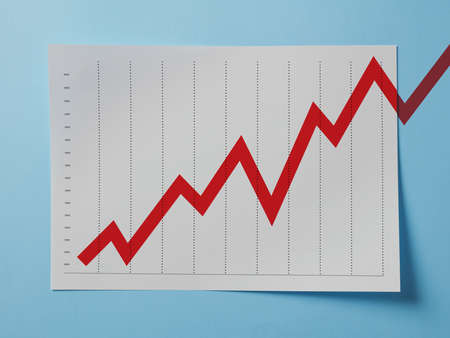
Growing chart on A4 page on blue background
Коллекция по умолчанию
Коллекция по умолчанию
Создать новую
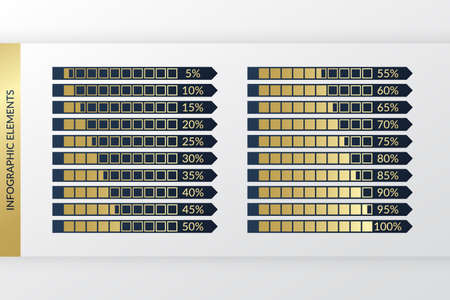
Vector percentage charts infographics.
Коллекция по умолчанию
Коллекция по умолчанию
Создать новую
Business documents at workplace, financial report, close up
Коллекция по умолчанию
Коллекция по умолчанию
Создать новую
Image of infographic interface over modern cityscape against cloudy sky. Digital composite, multiple exposure, report, business, growth, global, progress and architecture concept.
Коллекция по умолчанию
Коллекция по умолчанию
Создать новую
Legion-Media
Создайте свои проекты на основе качественных стоковых фотографий и видео.


Copyright © Legion-Media.