

Radiated emissions spectrogram with limit lines in EMC electromagnetic compatibility test report
Коллекция по умолчанию
Коллекция по умолчанию
Создать новую

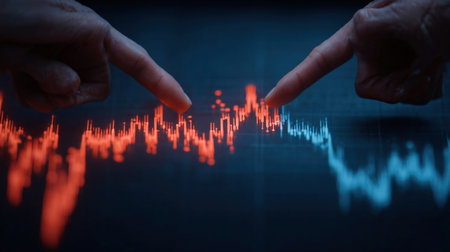
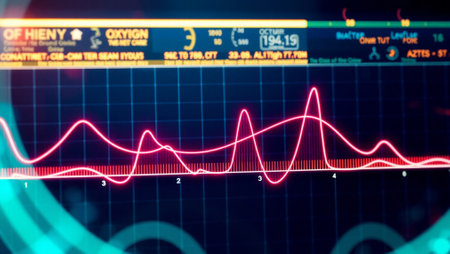
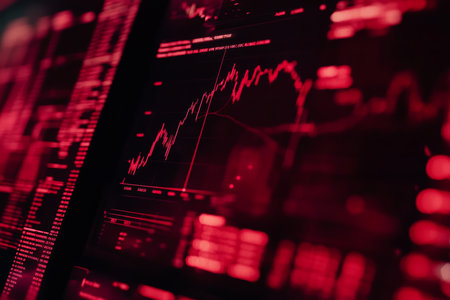
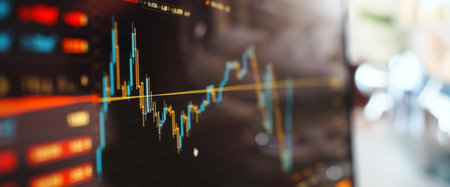
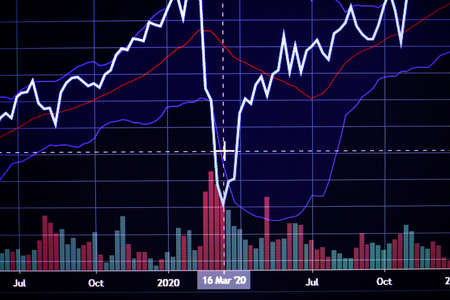
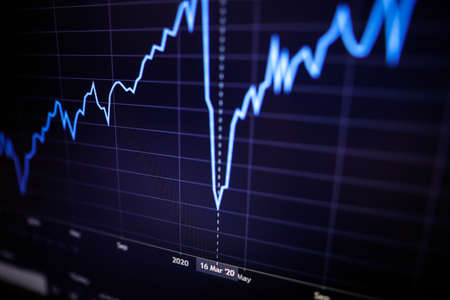
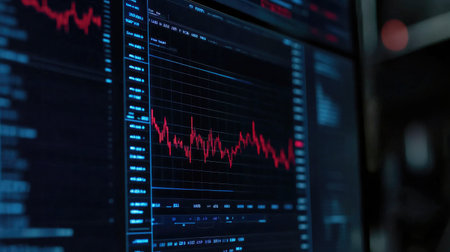
Shallow depth of field (selective focus) with details of a chart showing the stock market crash from March 2020 due to the Covid-19 pandemic on a computer screen (S&P500 index)
Коллекция по умолчанию
Коллекция по умолчанию
Создать новую

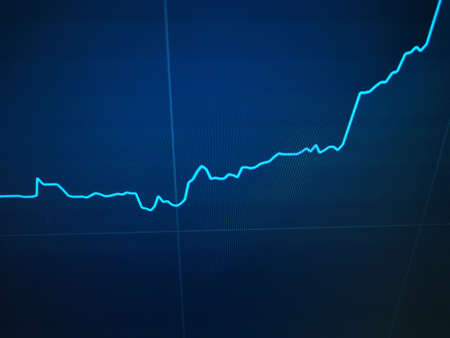
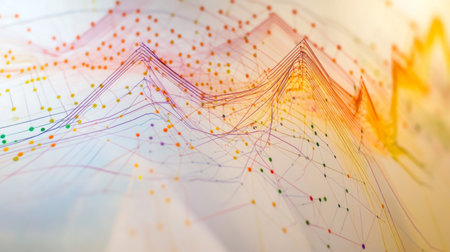
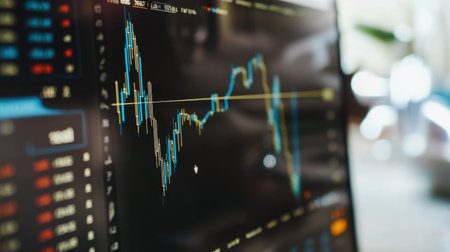
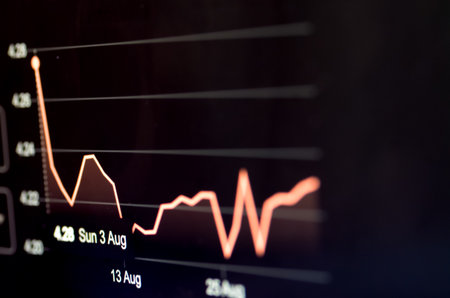
image of the financial graph on a computer monitor.
Коллекция по умолчанию
Коллекция по умолчанию
Создать новую

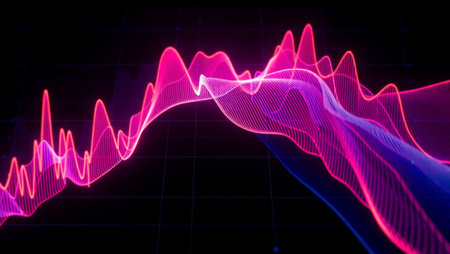
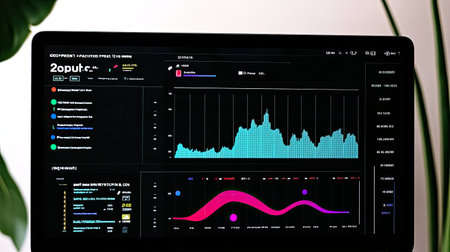
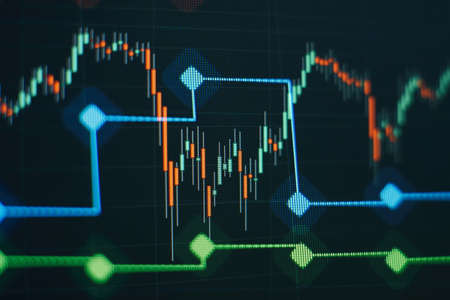
Financial instruments with various types of indicators including volume analysis for professional technical analysis
Коллекция по умолчанию
Коллекция по умолчанию
Создать новую

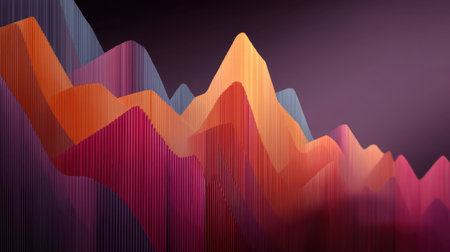
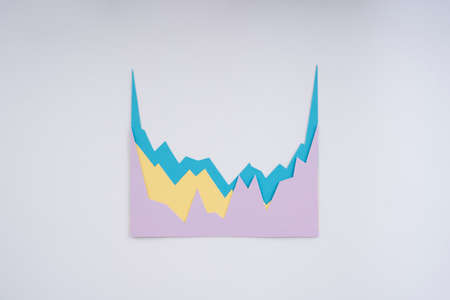
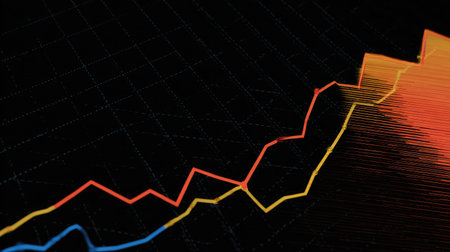
Business chart with line graph, bar chart and numbers on dark background, 3d rendering. Computer digital drawing.
Коллекция по умолчанию
Коллекция по умолчанию
Создать новую
This abstract image showcases sound waves as they depict audio frequency patterns with sharp peaks and valleys, creating a modern visual representation.
Коллекция по умолчанию
Коллекция по умолчанию
Создать новую

Financial stock market graph. Stock Exchange. Selective focus.
Коллекция по умолчанию
Коллекция по умолчанию
Создать новую
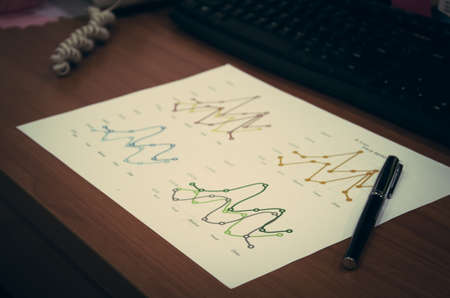
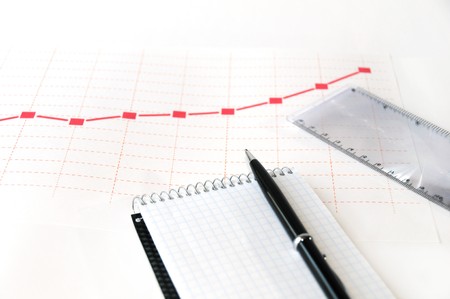
Line graph on desk and pen. Vintage filter
Коллекция по умолчанию
Коллекция по умолчанию
Создать новую
The dynamics of changes in currencies. Price growth chart and economic recovery
Коллекция по умолчанию
Коллекция по умолчанию
Создать новую

diagram pointing down. decline drop reduction concept. exponential curve on dark blue backdrop.
Коллекция по умолчанию
Коллекция по умолчанию
Создать новую
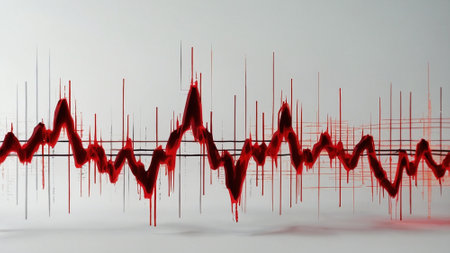
A striking abstract representation of an audio waveform, showcasing vibrant red and orange tones against a dark background. Ideal for music and technology themes.
Коллекция по умолчанию
Коллекция по умолчанию
Создать новую

Child's hand arranging wood blocks in a step stair concept. Concept for growth, strategy, success process or investment goals.
Коллекция по умолчанию
Коллекция по умолчанию
Создать новую
Abstract background of a digital glitch.
Коллекция по умолчанию
Коллекция по умолчанию
Создать новую

graph of financial growth on a computer monitor.
Коллекция по умолчанию
Коллекция по умолчанию
Создать новую
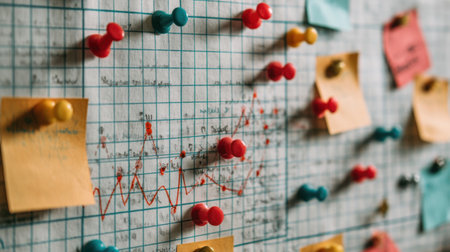
A visually engaging workspace featuring colorful push pins and sticky notes on graph paper, illustrating data representation and enhancing creative organization for projects.
Коллекция по умолчанию
Коллекция по умолчанию
Создать новую

Statistical financial graph predicting an economic depression after a 2020 global coronavirus pandemic.
Коллекция по умолчанию
Коллекция по умолчанию
Создать новую

Impact of coronavirus COVID-19 on the global economy, Financial crisis 2020.
Коллекция по умолчанию
Коллекция по умолчанию
Создать новую

Financial graphs and charts analysis
Коллекция по умолчанию
Коллекция по умолчанию
Создать новую

Dark-themed banner with a striking red graphic design, featuring sleek diagrams, charts, and a modern presentation layout. Perfect for data visualization, professional reports.
Коллекция по умолчанию
Коллекция по умолчанию
Создать новую
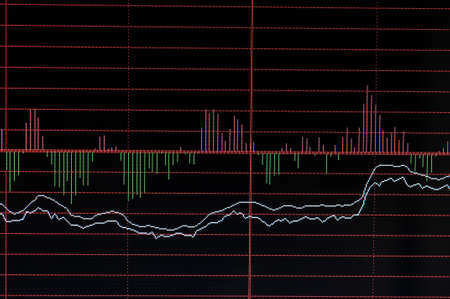
Indicators including volume analysis for professional technical analysis on the monitor of a computer. Fundamental and technical analysis concept.
Коллекция по умолчанию
Коллекция по умолчанию
Создать новую
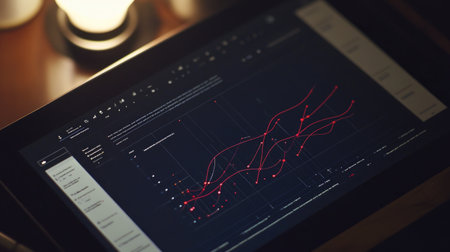
A close-up view of a digital tablet displaying an intricate data visualization. The bright lines and points create a striking contrast against the dark background.
Коллекция по умолчанию
Коллекция по умолчанию
Создать новую
A stunning abstract representation of colorful waves and data flow, capturing the essence of modern technology and digital innovation in a captivating 3D visualization.
Коллекция по умолчанию
Коллекция по умолчанию
Создать новую
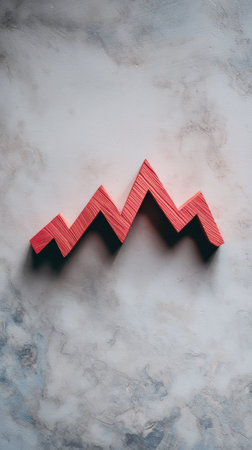
A bold red zigzag trend line rests on a smooth marble surface highlighting an upward movement in analysis or design concepts.
Коллекция по умолчанию
Коллекция по умолчанию
Создать новую

Close up image of colored wooden blocks as a graph
Коллекция по умолчанию
Коллекция по умолчанию
Создать новую

Stock market or forex trading graph in graphic concept suitable for financial investment or Economic trends business idea and all art work design.
Коллекция по умолчанию
Коллекция по умолчанию
Создать новую
A geometric representation displays audio frequencies in three-dimensional form with varying heights and shapes indicating different sound levels.
Коллекция по умолчанию
Коллекция по умолчанию
Создать новую
Close up of hand pointing at glowing business chart on dark blue background. Stock, market and trade concept.
Коллекция по умолчанию
Коллекция по умолчанию
Создать новую

Abstract technology background connecting dots and lines in grid data. Visual presentation of analytics data algorithms.
Banner for business, science and technology analytics representation. Big data concepte.
Коллекция по умолчанию
Коллекция по умолчанию
Создать новую

Virus pandemic covid-19 map on pc screen, global infection, internet.
Коллекция по умолчанию
Коллекция по умолчанию
Создать новую
professionals analyzing financial data. Red digital graphs overlaid in a modern office environment, integrating technology and data analysis into daily business operations.
Коллекция по умолчанию
Коллекция по умолчанию
Создать новую

indicators including volume analysis for professional technical analysis on the monitor of a computer. Fundamental and technical analysis concept.
Коллекция по умолчанию
Коллекция по умолчанию
Создать новую

Business and Economy Theme. Trading Cryptocurrencies. Stock Market Candles Chart on Computer Display Close Up.
Коллекция по умолчанию
Коллекция по умолчанию
Создать новую
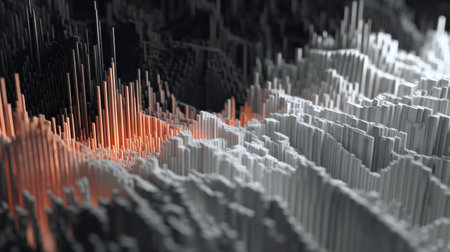
This abstract data visualization features striking red and white peaks against a stark black background, creating a captivating visual experience.
Коллекция по умолчанию
Коллекция по умолчанию
Создать новую

Business financial or stock market background. Business graph on stock market financial exchange
Коллекция по умолчанию
Коллекция по умолчанию
Создать новую

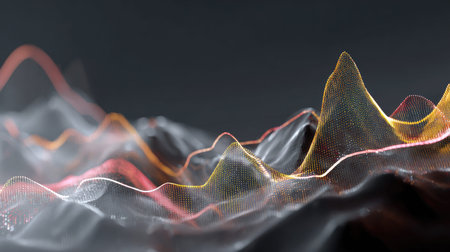
Conceptual abstract geometric 3d shape built of wires or thin digital threads creating volumetric illusion. Dynamic weave of hairlines in blue orange hues in deep dark space.
Коллекция по умолчанию
Коллекция по умолчанию
Создать новую

colorful, five rainbow colored sponges on blue background
Коллекция по умолчанию
Коллекция по умолчанию
Создать новую

Abstract business problem solving concept. String finding route through a pin board. 3D Rendering
Коллекция по умолчанию
Коллекция по умолчанию
Создать новую

Impact of coronavirus COVID-19 on the global economy, financial crisis.
Коллекция по умолчанию
Коллекция по умолчанию
Создать новую
A sleek financial graph showcasing upward trends in a business context, featuring a bold line chart with dynamic colors against a subtle gradient background.
Коллекция по умолчанию
Коллекция по умолчанию
Создать новую

Stock market graphic. Stock price chart. 3D render.
Коллекция по умолчанию
Коллекция по умолчанию
Создать новую

The Stock Exchange, Streaming Trade Screen, The stock screen shows a list of stocks with reduced value.
Коллекция по умолчанию
Коллекция по умолчанию
Создать новую

Plexus abstract technology background connecting lines and dots over digital screen
Коллекция по умолчанию
Коллекция по умолчанию
Создать новую
This image showcases an abstract representation of data visualization, featuring colorful dots and lines on a minimalist background, perfect for tech-related projects.
Коллекция по умолчанию
Коллекция по умолчанию
Создать новую
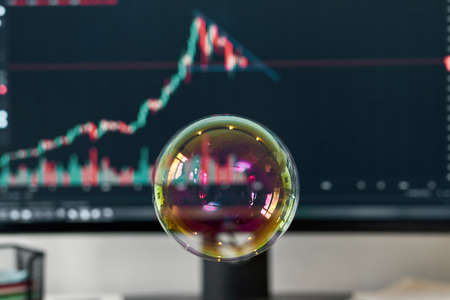
Close up soap bubble, trading graphics on computer device on background
Коллекция по умолчанию
Коллекция по умолчанию
Создать новую
abstract 3d illustration of sound wave with red gradient in white background
Коллекция по умолчанию
Коллекция по умолчанию
Создать новую
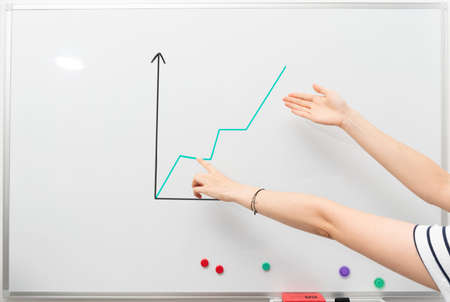
Image of white magnetic board with bussines chart report.
Коллекция по умолчанию
Коллекция по умолчанию
Создать новую
financial chart on the digital screen. Business concept of financial analysis and investment.
Коллекция по умолчанию
Коллекция по умолчанию
Создать новую
Dynamic digital interface illustrating stock market trends with red highlights and data analysis
Коллекция по умолчанию
Коллекция по умолчанию
Создать новую
An overhead shot of a 3D line graph showing multiple data points and trends, with axes clearly labeled and the lines extending dynamically across the graph's surface.
Коллекция по умолчанию
Коллекция по умолчанию
Создать новую

A digital financial chart showing stock prices fluctuating over time, with a clear focus on the upward trends, set against a minimalist white background
Коллекция по умолчанию
Коллекция по умолчанию
Создать новую

Vibrant candlestick patterns and descending trend lines illustrate a market downturn, highlighting analysis tools amid a somber financial atmosphere.
Коллекция по умолчанию
Коллекция по умолчанию
Создать новую

Trader investor broker holding finger using cell phone app executing financial stock trade market trading order to buy or sell
Коллекция по умолчанию
Коллекция по умолчанию
Создать новую
3d illustration of a sound wave on a dark background with blue and pink lines
Коллекция по умолчанию
Коллекция по умолчанию
Создать новую
This abstract image features vibrant wave patterns in rich colors, ideal for visuals related to data analysis, digital graphics, and modern design concepts.
Коллекция по умолчанию
Коллекция по умолчанию
Создать новую

Futuristic UI HUD Head up display analytic screen with sensors detectors and bars
Коллекция по умолчанию
Коллекция по умолчанию
Создать новую
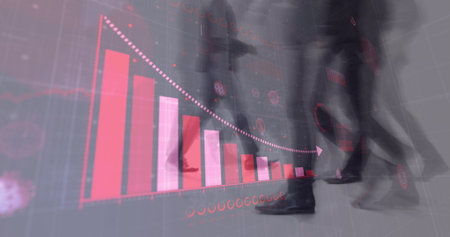
Covid-19 statistical data processing against time-lapse of group of people walking. Covid-19 coronavirus pandemic concept
Коллекция по умолчанию
Коллекция по умолчанию
Создать новую

A stock market graph on a black background.
Коллекция по умолчанию
Коллекция по умолчанию
Создать новую

Candle stick graph chart with indicator showing bullish point or bearish point, up trend or down trend of price of stock market or stock exchange trading, investment and financial concept.
Коллекция по умолчанию
Коллекция по умолчанию
Создать новую

Data analyzing in Forex, Commodities, Equities, Fixed Income and Emerging Markets: the charts and summary info show about Business statistics and Analytics value - Wealth management concept.
Коллекция по умолчанию
Коллекция по умолчанию
Создать новую

Shallow depth of field (selective focus) with details of a candlestick chart on a computer screen.
Коллекция по умолчанию
Коллекция по умолчанию
Создать новую
Vibrant wavy lines in yellow, orange, and red move with a rhythmic flow against a neutral background, showing a dynamic and energetic visual experience.
Коллекция по умолчанию
Коллекция по умолчанию
Создать новую
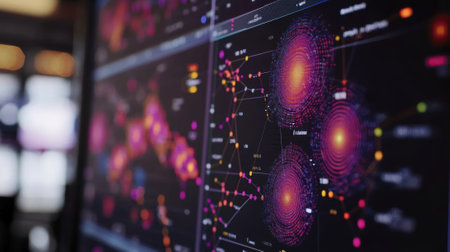
Big data analysis showing colorful circular diagrams on multiple computer screens
Коллекция по умолчанию
Коллекция по умолчанию
Создать новую

Graphical representation of math functions and a pencil
Коллекция по умолчанию
Коллекция по умолчанию
Создать новую

Love arrows aiming at red heart. Generative Ai
Коллекция по умолчанию
Коллекция по умолчанию
Создать новую
Abstract image of financial data and stock market analysis with colorful graphs and charts, representing economic trends and market fluctuations.
Коллекция по умолчанию
Коллекция по умолчанию
Создать новую
Shallow depth of field (selective focus) with details of a chart showing the stock market crash from March 2020 due to the Covid-19 pandemic on a computer screen (S&P500 index)
Коллекция по умолчанию
Коллекция по умолчанию
Создать новую

This abstract image showcases sharp peaks and gradients, creating a dynamic visual interplay of light and shadow, perfect for modern design themes and creative projects.
Коллекция по умолчанию
Коллекция по умолчанию
Создать новую

Fundamental and technical analysis concept.
Коллекция по умолчанию
Коллекция по умолчанию
Создать новую

Follow stock prices, stock quotes and the rise and fall of the cryptocurrency on a mobile tablet. The hand draws on the tablet screen using a stylus. close-up small depth of field
Коллекция по умолчанию
Коллекция по умолчанию
Создать новую
A financial chart illustrates a notable surge in stock market profits, fueled by rising interest rates and consistent growth in money investments during recent months.
Коллекция по умолчанию
Коллекция по умолчанию
Создать новую
A sleek digital dashboard showcasing market analysis with engaging charts. Ideal for professionals seeking insights into financial performance and trends.
Коллекция по умолчанию
Коллекция по умолчанию
Создать новую

Financial stock market graph. Stock Exchange. Selective focus.
Коллекция по умолчанию
Коллекция по умолчанию
Создать новую
Analytic chart element, colorful infographics. Business statistic, diagram, data visualization, graph information.
Коллекция по умолчанию
Коллекция по умолчанию
Создать новую

financial graph on the monitor, business concept of financial data analysis.
Коллекция по умолчанию
Коллекция по умолчанию
Создать новую

indicators including volume analysis for professional technical analysis on the monitor of a computer. Fundamental and technical analysis concept.
Коллекция по умолчанию
Коллекция по умолчанию
Создать новую
This image showcases a vibrant abstract graph with dynamic lines and curves, symbolizing data analysis and innovation in a modern digital era, ideal for tech-themed projects.
Коллекция по умолчанию
Коллекция по умолчанию
Создать новую
Shallow depth of field (selective focus) with details of a chart showing the stock market crash from March 2020 due to the Covid-19 pandemic on a computer screen (S&P500 index)
Коллекция по умолчанию
Коллекция по умолчанию
Создать новую

Analyzing financial statistics and analyzing a market data. Data analysis from charts and graphs
Коллекция по умолчанию
Коллекция по умолчанию
Создать новую

Image of digital interface with graphs and virus cells over server room. Global digital network technology security concept digitally generated image.
Коллекция по умолчанию
Коллекция по умолчанию
Создать новую
Digital Finance: Analyzing Volatile Market Graphs and Managing Tiered Compensation Schedules on a Desktop.
Коллекция по умолчанию
Коллекция по умолчанию
Создать новую
A vibrant image of a large monitor displaying a detailed gold price chart with various technical indicators and a prominent upward trend in gold prices.
Коллекция по умолчанию
Коллекция по умолчанию
Создать новую
A vibrant arrangement of textured blocks showcases a playful blend of warm colors, including yellow, orange, and gray. The shapes create a modern, artistic expression.
Коллекция по умолчанию
Коллекция по умолчанию
Создать новую
Image of financial data processing, two lines with glowing spot on grid. global business finance concept digitally generated image.
Коллекция по умолчанию
Коллекция по умолчанию
Создать новую
3D abstract vector illustration of business data graph analysis on white background.
Коллекция по умолчанию
Коллекция по умолчанию
Создать новую

Color grading monitor. RGB colour correction indicator graph on screen in post production process. Telecine stage in video or film production processing. for colorist edit or adjust on digital movie.
Коллекция по умолчанию
Коллекция по умолчанию
Создать новую
graph of financial growth on a computer monitor. cryptocurrency.
Коллекция по умолчанию
Коллекция по умолчанию
Создать новую
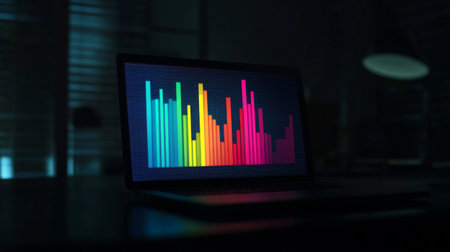
A vibrant sound wave visualization displayed on a laptop screen illuminates a dimly lit workspace, showcasing technology's role in music and data analysis.
Коллекция по умолчанию
Коллекция по умолчанию
Создать новую
market analyze. Bar graphs, Diagrams, financial figures. Abstract glowing forex chart interface wallpaper. Investment, trade, stock, finance
Коллекция по умолчанию
Коллекция по умолчанию
Создать новую
A live stock market billboard with gains and losses curves
Коллекция по умолчанию
Коллекция по умолчанию
Создать новую
The workplace of a businessman
Коллекция по умолчанию
Коллекция по умолчанию
Создать новую
Visual representation of financial growth trends in stock market investment and trading strategies
Коллекция по умолчанию
Коллекция по умолчанию
Создать новую

Indicators including volume analysis for professional technical analysis on the monitor of a computer. Fundamental and technical analysis concept.
Коллекция по умолчанию
Коллекция по умолчанию
Создать новую

Poster of the sound wave from equalizer.
Коллекция по умолчанию
Коллекция по умолчанию
Создать новую
Close-up of stock market data displayed on a digital interface, featuring red trend lines and charts. Ideal for finance and technology themes.
Коллекция по умолчанию
Коллекция по умолчанию
Создать новую

Financial stock market graph. Stock Exchange. Selective focus.
Коллекция по умолчанию
Коллекция по умолчанию
Создать новую

Businessmen miniature figure standing on investment and profit graph for analysis and discussion.
Коллекция по умолчанию
Коллекция по умолчанию
Создать новую
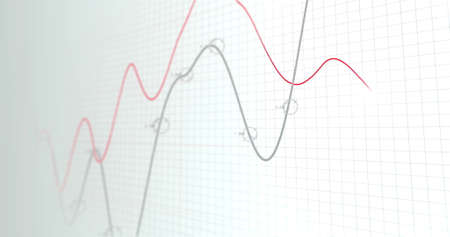
Image of financial data processing, two lines with glowing spot on grid. global business finance concept digitally generated image.
Коллекция по умолчанию
Коллекция по умолчанию
Создать новую
A visually appealing illustration of a dynamic financial chart with colorful lines representing growth trends, ideal for business and economic themes in presentations and reports.
Коллекция по умолчанию
Коллекция по умолчанию
Создать новую
Image of white magnetic board with bussines chart report.
Коллекция по умолчанию
Коллекция по умолчанию
Создать новую
3d rendering of abstract technology background with glowing lines and bokeh
Коллекция по умолчанию
Коллекция по умолчанию
Создать новую
Legion-Media
Создайте свои проекты на основе качественных стоковых фотографий и видео.


Copyright © Legion-Media.