

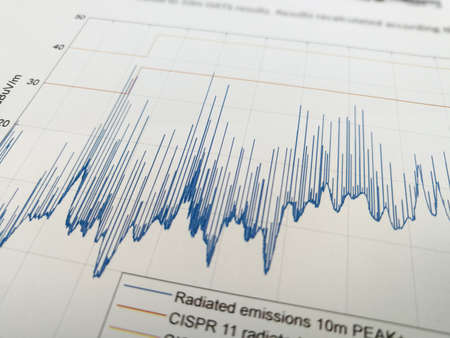
Radiated emissions spectrogram with limit lines in EMC electromagnetic compatibility test report
Коллекция по умолчанию
Коллекция по умолчанию
Создать новую
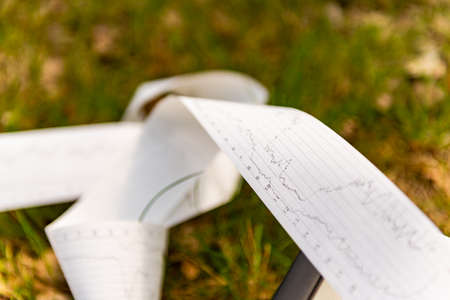
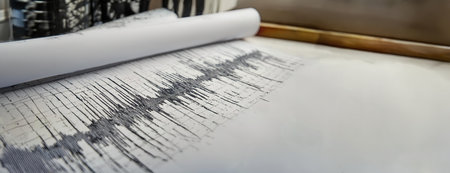
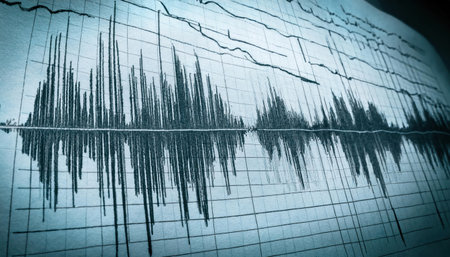
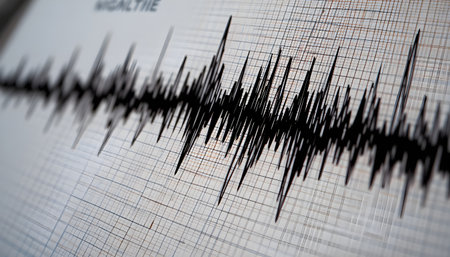
Seismological device for measuring earthquakes. Seismological activity live on the sheet of measuring paper.
Коллекция по умолчанию
Коллекция по умолчанию
Создать новую

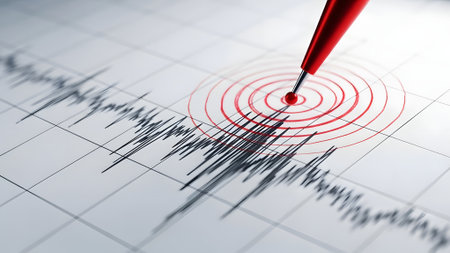
Detailed close-up view of a seismograph needle actively measuring earthquake activity, showcasing intricate patterns on a scientifically significant chart.
Коллекция по умолчанию
Коллекция по умолчанию
Создать новую

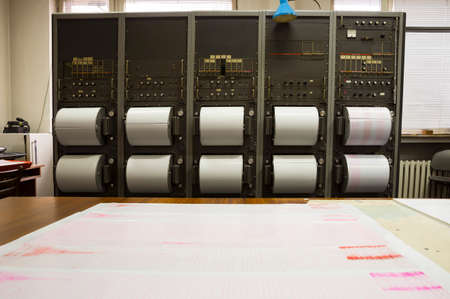
Paper comes out of an printing monitoring device
Коллекция по умолчанию
Коллекция по умолчанию
Создать новую
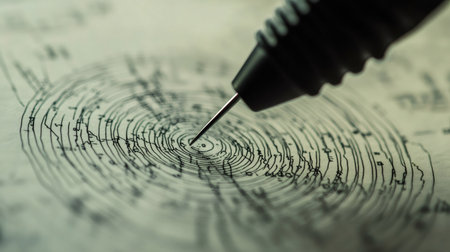
Geologist using a drafting compass drawing seismic waves expanding from the epicenter of an earthquake on a topographic map, studying geology and seismology
Коллекция по умолчанию
Коллекция по умолчанию
Создать новую
A sensitive needle meticulously traces the earth's powerful tremors onto a seismogram, capturing the raw data of a seismic event.
Коллекция по умолчанию
Коллекция по умолчанию
Создать новую
Electrocardiogram on blue background, close-up.
Коллекция по умолчанию
Коллекция по умолчанию
Создать новую

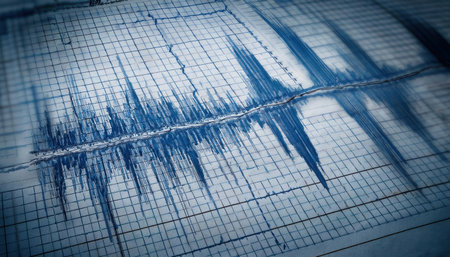
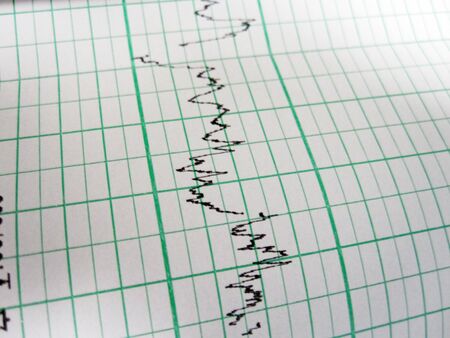
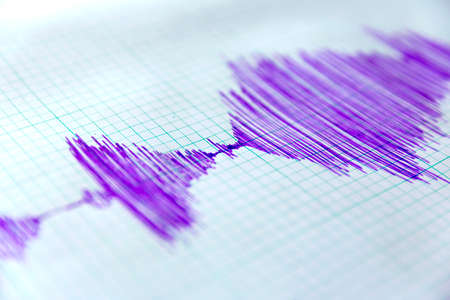
Seismological device for measuring earthquakes. Seismological activity live on the sheet of measuring paper. Earthquake wave on graph paper.
Коллекция по умолчанию
Коллекция по умолчанию
Создать новую
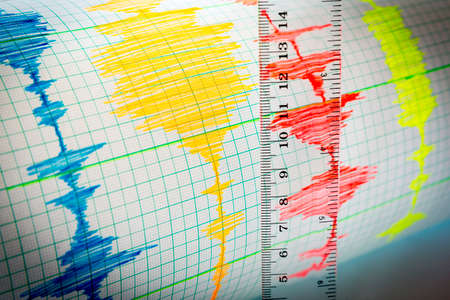
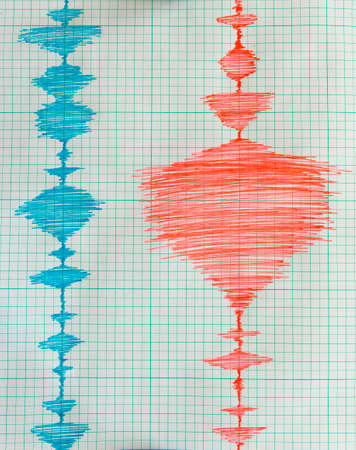
Seismological device for measuring earthquakes. Seismological activity lines on the sheet of measuring paper. Earthquake wave on graph paper. Vignette image. Ruler.
Коллекция по умолчанию
Коллекция по умолчанию
Создать новую

Seismological device for measuring earthquakes. Seismological activity live on the sheet of measuring paper.
Коллекция по умолчанию
Коллекция по умолчанию
Создать новую
Checking wood for rotten areas. A special device for analyzing the tree for its health. The device outputs all the data for each millimeter of the tree trunk.
Коллекция по умолчанию
Коллекция по умолчанию
Создать новую
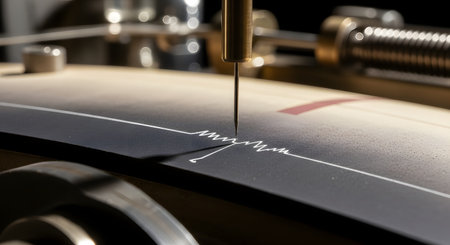
A detailed close-up of a seismograph machine with a fine needle drawing a jagged seismic wave on a moving paper. The image highlights the precise and intricate process of scientific measurement and the recording of earth movements.
Коллекция по умолчанию
Коллекция по умолчанию
Создать новую
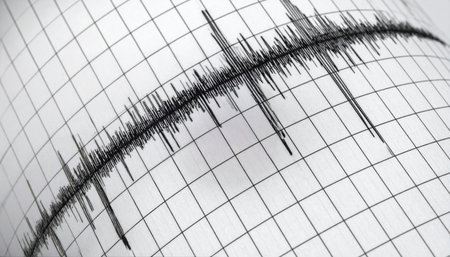
Seismograph paper with a bold earthquake wave line showing seismic activity.
Коллекция по умолчанию
Коллекция по умолчанию
Создать новую
A close-up view captures the critical moment as a seismograph's needle meticulously records the earth's tremors.
Коллекция по умолчанию
Коллекция по умолчанию
Создать новую
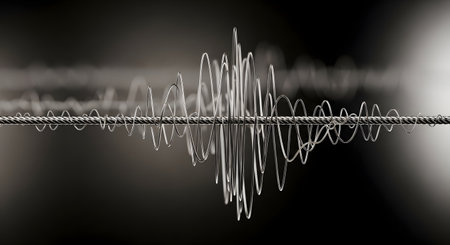
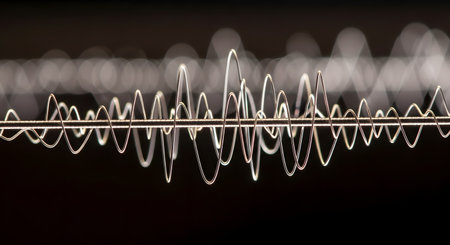
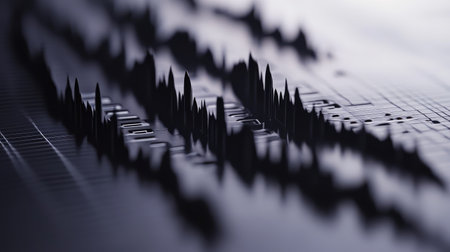
A monochromatic, abstract visualization of a complex soundwave or data signal traveling along a central twisted cable. The chaotic, wiry waveform represents concepts like communication, vibration, frequency, or the transmission of information. The shallow depth of field on a dark background creates a technical and artistic feel.
Коллекция по умолчанию
Коллекция по умолчанию
Создать новую

World Earthquake Map, Fault Lines, Epicenters, and Seismic Activity
Коллекция по умолчанию
Коллекция по умолчанию
Создать новую
Lie detector or seismograph for earthquake detection. Generative Ai
Коллекция по умолчанию
Коллекция по умолчанию
Создать новую
Seismological device for measuring earthquakes. Seismological activity live on the sheet of measuring paper.
Коллекция по умолчанию
Коллекция по умолчанию
Создать новую
detail of a graph of a fetus heatbeat
Коллекция по умолчанию
Коллекция по умолчанию
Создать новую

This striking image features an abstract representation of sound waves and audio frequencies, showcasing vibrant colors and intricate graphical elements.
Коллекция по умолчанию
Коллекция по умолчанию
Создать новую
This image showcases a vibrant digital waveform set against a circular background, symbolizing data analysis and sound frequency in modern technology.
Коллекция по умолчанию
Коллекция по умолчанию
Создать новую

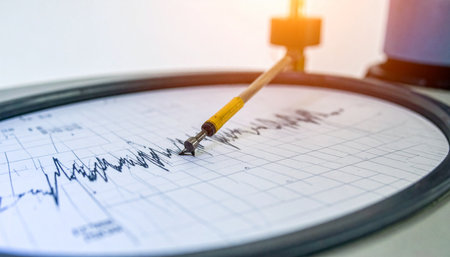
Seismograph records an earthquake on the sheet of measuring paper. Seismological device for measuring earthquakes. Seismograph machine needle drawing a red line on graph paper measuring activity.
Коллекция по умолчанию
Коллекция по умолчанию
Создать новую
Technology of sound
Коллекция по умолчанию
Коллекция по умолчанию
Создать новую

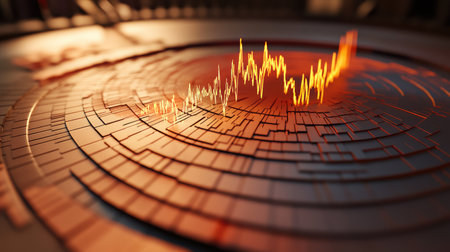
Stunning abstract artwork showcasing a dynamic data trend visualization with vibrant colors in a circular pattern, symbolizing growth and innovation.
Коллекция по умолчанию
Коллекция по умолчанию
Создать новую

Red seismic wave over Myanmar map
Коллекция по умолчанию
Коллекция по умолчанию
Создать новую

Seismological device for measuring earthquakes. Seismological activity live on the sheet of measuring paper.
Коллекция по умолчанию
Коллекция по умолчанию
Создать новую
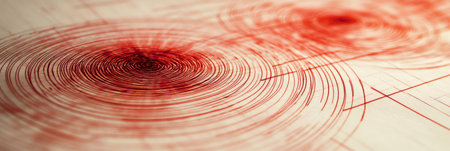
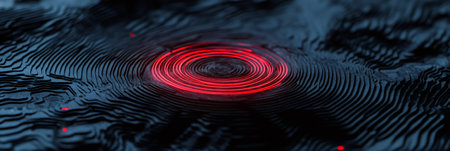
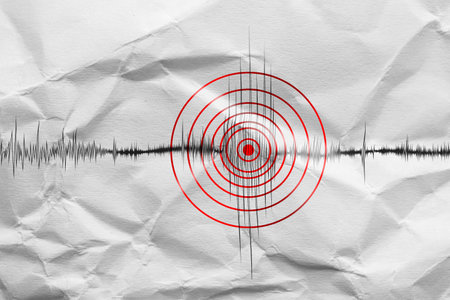
Red concentric circles represent seismic waves spreading from the epicenter of an earthquake, creating a visual representation of geological activity and ground shaking
Коллекция по умолчанию
Коллекция по умолчанию
Создать новую
Red concentric circles representing seismic waves are spreading from the epicenter of an earthquake on a dark topographic map, highlighting the impact and propagation of the tremors
Коллекция по умолчанию
Коллекция по умолчанию
Создать новую

This abstract image showcases vibrant audio waves in orange and yellow tones, emphasizing sound analysis and modern data visualization techniques in a creative format.
Коллекция по умолчанию
Коллекция по умолчанию
Создать новую

Seismograph instrument recording ground motion during earthquake
Коллекция по умолчанию
Коллекция по умолчанию
Создать новую
Seismological device for measuring earthquakes. Seismological activity live on the sheet of measuring paper. Earthquake wave on graph paper.
Коллекция по умолчанию
Коллекция по умолчанию
Создать новую
Seismograph printout showing seismic activity lines on a rolling paper with equipment in the background, illustrating the scientific monitoring of earthquake activity and data analysis
Коллекция по умолчанию
Коллекция по умолчанию
Создать новую
Seismological device for measuring earthquakes. Seismological activity live on the sheet of measuring paper. Earthquake wave on graph paper.
Коллекция по умолчанию
Коллекция по умолчанию
Создать новую
sound audio wave abstract background
Коллекция по умолчанию
Коллекция по умолчанию
Создать новую
Charting medical data on unmarked graph paper
Коллекция по умолчанию
Коллекция по умолчанию
Создать новую
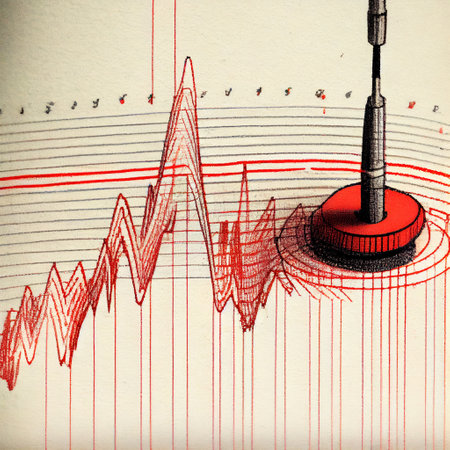
An antique seismograph sketch on coarse parchment, illustrating fluctuating wave patterns with handcrafted notes in rich sepia shades.
Коллекция по умолчанию
Коллекция по умолчанию
Создать новую
Vibrant red and white digital patterns ripple across a glossy surface, creating a striking symmetry with bold vertical peaks set against a soft gray backdrop.
Коллекция по умолчанию
Коллекция по умолчанию
Создать новую
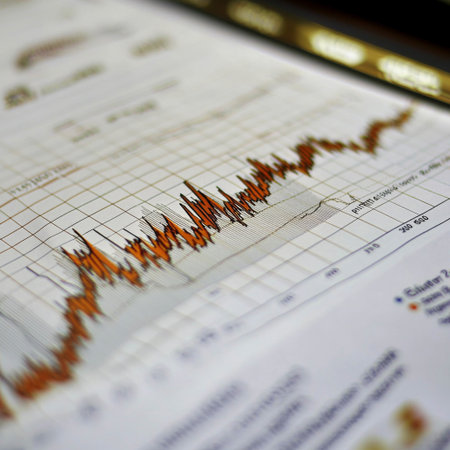
A luxury-themed financial report page with a gold line graph and stock market indicators
Коллекция по умолчанию
Коллекция по умолчанию
Создать новую
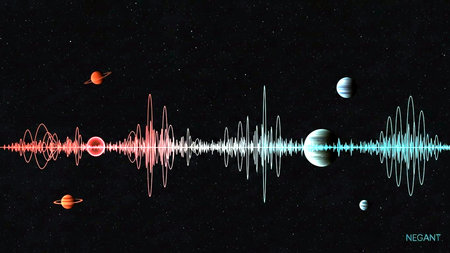
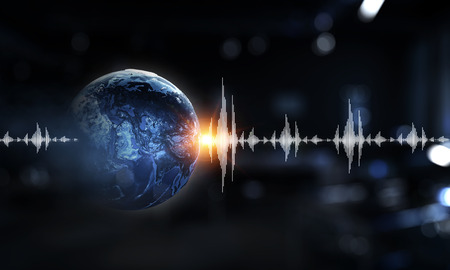
Vibrant red and blue sound waves ripple across a star-filled galaxy, featuring planets like Saturn and Jupiter, symbolizing cosmic harmony, data visualization, and the vastness of scientific discovery.
Коллекция по умолчанию
Коллекция по умолчанию
Создать новую
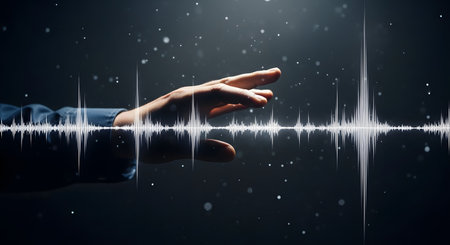
A human hand reaches out and interacts with a glowing digital audio waveform against a dark, futuristic background with floating particles. This conceptual image represents sound technology, voice recognition, audio engineering, and the digital world.
Коллекция по умолчанию
Коллекция по умолчанию
Создать новую
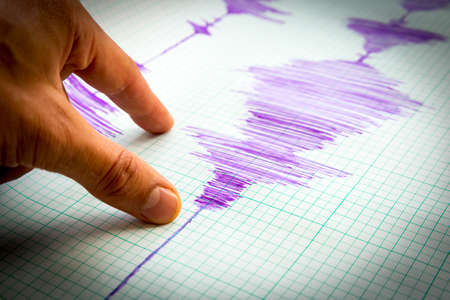
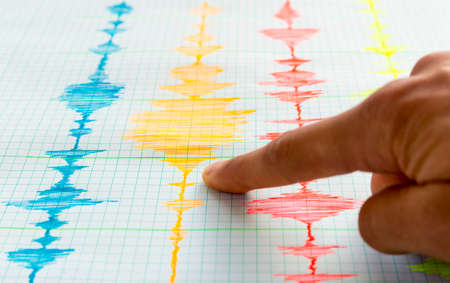
Seismological device for measuring earthquakes. Seismological activity lines on the sheet of measuring paper. Earthquake wave on graph paper. Vignette image. Human finger showing a detail.
Коллекция по умолчанию
Коллекция по умолчанию
Создать новую
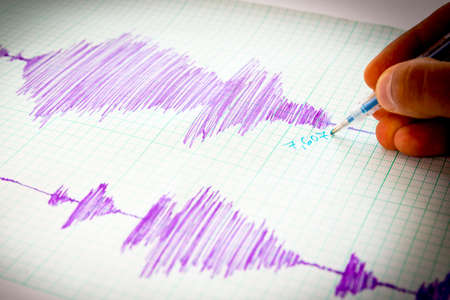
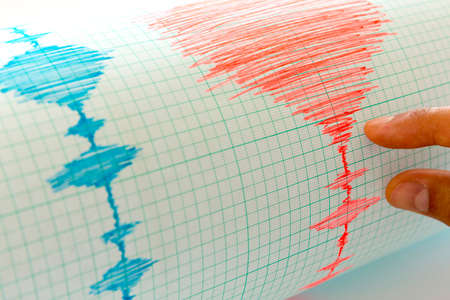
Seismological device for measuring earthquakes. Seismological activity lines on the sheet of measuring paper. Earthquake wave on graph paper. Vignette image. Human hand writing down with a blue pen.
Коллекция по умолчанию
Коллекция по умолчанию
Создать новую
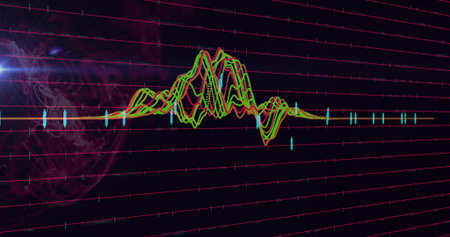
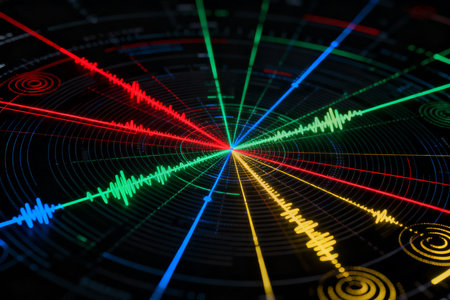
Displaying neon-colored waveforms undulating with sphere and cyan bars over magenta grid lines. Futuristic, digital, abstract, data, technology, visualization, neon
Коллекция по умолчанию
Коллекция по умолчанию
Создать новую

Seismic activity earthquake New Mexico map Richter scale
Коллекция по умолчанию
Коллекция по умолчанию
Создать новую
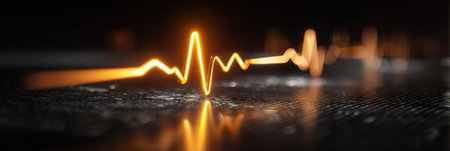
A vivid pulse line glows in warm orange tones, reflecting off a smooth surface, illustrating energy and rhythm in a dark setting.
Коллекция по умолчанию
Коллекция по умолчанию
Создать новую

Seismograph printout showing seismic activity lines on a rolling paper with equipment in the background, illustrating the scientific monitoring of earthquake activity and data analysis
Коллекция по умолчанию
Коллекция по умолчанию
Создать новую
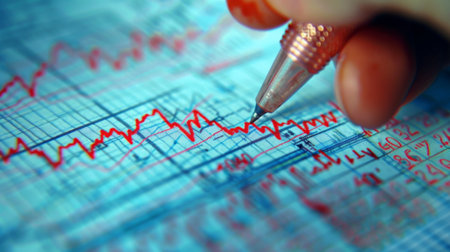
A close-up of a hand drawing trend lines and annotations on a financial graph, depicting analysis and forecasting
Коллекция по умолчанию
Коллекция по умолчанию
Создать новую
Results of an electroencephalogram after a neurophysiological examination, which is the recording of brain bioelectric activity at rest, wakefulness or sleep, made with electroence
Коллекция по умолчанию
Коллекция по умолчанию
Создать новую

Seismograph data of a large earthquake. Seismic waves on the report page. 3D illustration.
Коллекция по умолчанию
Коллекция по умолчанию
Создать новую

Audio sound wave studio editing computer program screen showings sounds on screen from vocal recording of voiceover.
Коллекция по умолчанию
Коллекция по умолчанию
Создать новую

Close-up of a cardiogram with a syringe in a clinical setting. The image captures essential health monitoring elements, emphasizing the medical field.
Коллекция по умолчанию
Коллекция по умолчанию
Создать новую
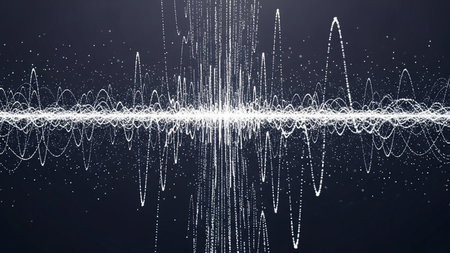
A visualization of a sound wave made of white glowing particles and lines against a dark background.
Коллекция по умолчанию
Коллекция по умолчанию
Создать новую
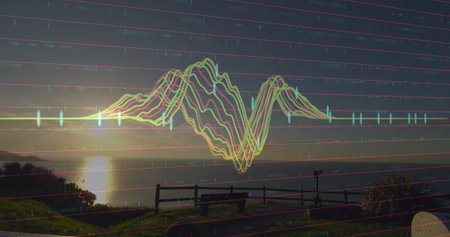
Multicolored waveform overlaying lakeshore at sunset, with bench lamppost grid lines axis labels. Scenic, tranquil, modern, digital, landscape, analysis, reflective
Коллекция по умолчанию
Коллекция по умолчанию
Создать новую

Sound recording studio audio wave on computer screen in professional editing program for voice, vocal, dj deejay musical mixing
Коллекция по умолчанию
Коллекция по умолчанию
Создать новую
Authentic Turkish Dessert with Rich Syrup
Коллекция по умолчанию
Коллекция по умолчанию
Создать новую
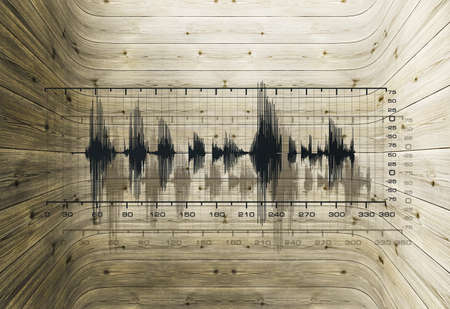
Uneven frequencies in a closed cavity made of wood
Коллекция по умолчанию
Коллекция по умолчанию
Создать новую

Earthquake. Richter Earthquake Magnitude Scale. Vector illustration. EPS 10
Коллекция по умолчанию
Коллекция по умолчанию
Создать новую
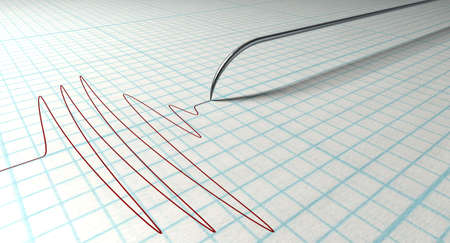
A closeup of a polygraph lie detector test needledrawing a red line on graph paper on an isolated white background
Коллекция по умолчанию
Коллекция по умолчанию
Создать новую
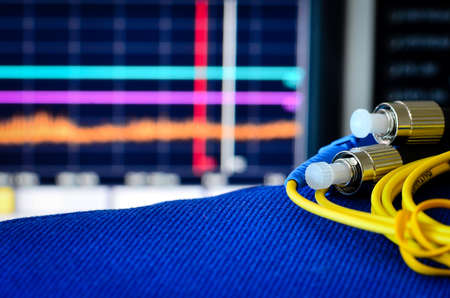
Fibre optic cable with spectrum analyser in the background
Коллекция по умолчанию
Коллекция по умолчанию
Создать новую
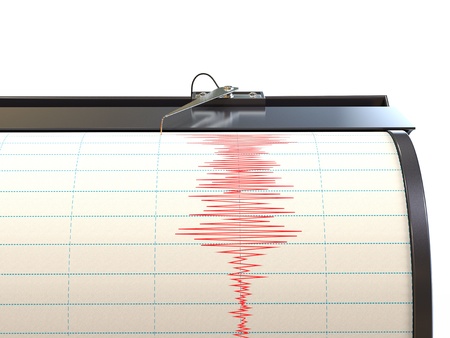
Seismograph instrument recording ground motion during earthquake
Коллекция по умолчанию
Коллекция по умолчанию
Создать новую
This abstract image showcases vibrant audio waves in orange and yellow tones, emphasizing sound analysis and modern data visualization techniques in a creative format.
Коллекция по умолчанию
Коллекция по умолчанию
Создать новую
A close-up view of an audio spectrum displayed on a computer screen. The waveform shows a combination of blue and green lines, indicating different frequencies and amplitudes of the audio signal. The graph is detailed with grid lines for precise measurement.
Коллекция по умолчанию
Коллекция по умолчанию
Создать новую
Photograph of a person using his hand to point on the white screen with a graph or seismograph in black colour
Коллекция по умолчанию
Коллекция по умолчанию
Создать новую

Seismological device for measuring earthquakes. Seismological activity lines on the sheet of measuring paper. Earthquake wave on graph paper. Vignette image. Human finger showing a detail.
Коллекция по умолчанию
Коллекция по умолчанию
Создать новую
Abstract sound wave visualization with blue and green glowing lines on a dark grid background.
Коллекция по умолчанию
Коллекция по умолчанию
Создать новую
A detailed view of an audio waveform, likely from a recording or sound analysis, displayed on a digital interface.
Коллекция по умолчанию
Коллекция по умолчанию
Создать новую
financial chart on the monitor as a concept of financial crisis and recession
Коллекция по умолчанию
Коллекция по умолчанию
Создать новую
Close-up of a red dart pointing at a bullseye on a financial chart
Коллекция по умолчанию
Коллекция по умолчанию
Создать новую

Seismological device for measuring earthquakes. Seismological activity live on the sheet of measuring paper. Earthquake wave on graph paper.
Коллекция по умолчанию
Коллекция по умолчанию
Создать новую

Abstract wavy background, colorful pattern, 3d rendering. Computer digital drawing.
Коллекция по умолчанию
Коллекция по умолчанию
Создать новую

Delicious Dessert Pistachio Baklava
Коллекция по умолчанию
Коллекция по умолчанию
Создать новую

Sound recording studio audio wave on computer screen in professional editing program for voice, vocal, dj deejay musical mixing
Коллекция по умолчанию
Коллекция по умолчанию
Создать новую
abstract technology background with glowing lines and dots. 3d rendering
Коллекция по умолчанию
Коллекция по умолчанию
Создать новую
Seismograph records an earthquake on the sheet of measuring paper. Seismological device for measuring earthquakes. Seismograph machine needle drawing a red line on graph paper measuring activity.
Коллекция по умолчанию
Коллекция по умолчанию
Создать новую
Radiated emissions spectrogram with limit lines in EMC electromagnetic compatibility test report
Коллекция по умолчанию
Коллекция по умолчанию
Создать новую
Image of graphs and financial data on dark background. Global finance, economy and technology concept digitally generated image.
Коллекция по умолчанию
Коллекция по умолчанию
Создать новую
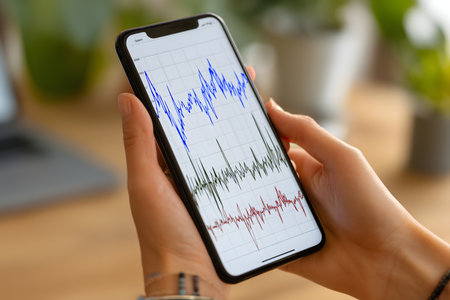
Smartphone with cardiogram on screen in female hands. Close up
Коллекция по умолчанию
Коллекция по умолчанию
Создать новую
Electrocardiogram on a white background, close-up
Коллекция по умолчанию
Коллекция по умолчанию
Создать новую

A detailed close-up of a seismograph in action, showcasing a pen recording earthquake vibrations on graph paper, highlighting scientific exploration in geology.
Коллекция по умолчанию
Коллекция по умолчанию
Создать новую
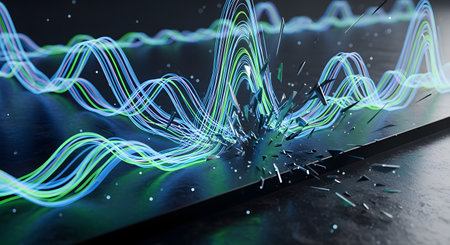
An abstract 3D rendering depicts glowing, multi-colored lines of light, representing sound waves or data streams, impacting a dark surface and causing it to shatter into fragments. The dynamic scene conveys energy, power, and technological disruption. It can be used to illustrate concepts like data analysis, sound impact, or digital communication.
Коллекция по умолчанию
Коллекция по умолчанию
Создать новую
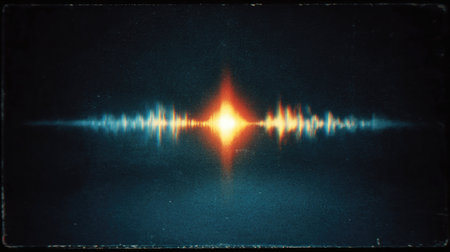
An abstract visualization of a soundwave or digital signal, rendered as a glowing, oscillating line against a dark background. Out-of-focus bokeh lights add depth to the image, which represents concepts like audio, frequency, communication, data, and modern technology.
Коллекция по умолчанию
Коллекция по умолчанию
Создать новую
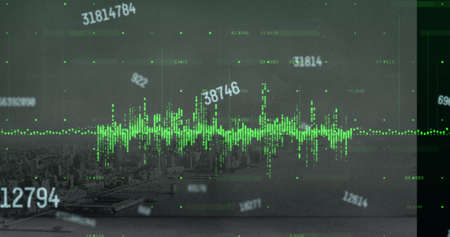
Image of financial data processing over cityscape. Global business, finances, data processing and digital interface concept digitally generated image.
Коллекция по умолчанию
Коллекция по умолчанию
Создать новую

Cardiogram on a sheet of paper close-up. Texture of pulsed waves.
Коллекция по умолчанию
Коллекция по умолчанию
Создать новую
This abstract image showcases sound waves as they depict audio frequency patterns with sharp peaks and valleys, creating a modern visual representation.
Коллекция по умолчанию
Коллекция по умолчанию
Создать новую
Dynamic visual representation of sound waves, showcasing vibrant colors and energetic patterns. Perfect for music, technology, and abstract concepts.
Коллекция по умолчанию
Коллекция по умолчанию
Создать новую
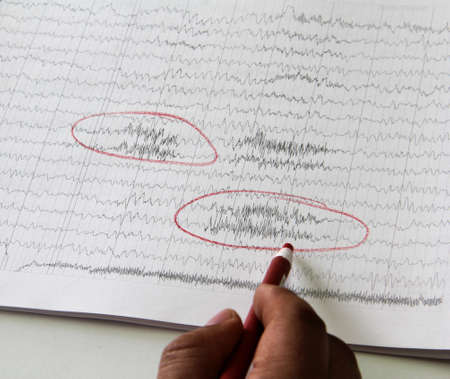
Earthquake marked with red circles on seismogram. Graph from seismometer
Коллекция по умолчанию
Коллекция по умолчанию
Создать новую

Shallow depth of field (selective focus) with details of a chart showing the stock market crash from March 2020 due to the Covid-19 pandemic on a computer screen (S&P500 index)
Коллекция по умолчанию
Коллекция по умолчанию
Создать новую
Close-up of digital audio waveforms on computer screens in a recording studio. That the image is generated using AI.
Коллекция по умолчанию
Коллекция по умолчанию
Создать новую
A dynamic, glowing red sound waveform pulsates vertically against a dark background, with a subtle digital circuit pattern visible at the base.
Коллекция по умолчанию
Коллекция по умолчанию
Создать новую
Glitch texture creating abstract patterns in distorted digital noise
Коллекция по умолчанию
Коллекция по умолчанию
Создать новую
waveform in stereo created in audio editing program
Коллекция по умолчанию
Коллекция по умолчанию
Создать новую
A divided composition with a horizontal line dividing the image, mirrored reflection
Коллекция по умолчанию
Коллекция по умолчанию
Создать новую
Charts of financial instruments with various type of indicators including volume analysis for professional technical analysis on the monitor of a computer.
Коллекция по умолчанию
Коллекция по умолчанию
Создать новую

Color grading monitor. RGB colour correction indicator graph on screen in post production process. Telecine stage in video or film production processing. for colorist edit or adjust on digital movie.
Коллекция по умолчанию
Коллекция по умолчанию
Создать новую

Red sound wave on a black background. Copy space.
Коллекция по умолчанию
Коллекция по умолчанию
Создать новую

A detailed shot of a pen engraving on a wooden surface, highlighting the craftsmanship and precision involved.
Коллекция по умолчанию
Коллекция по умолчанию
Создать новую
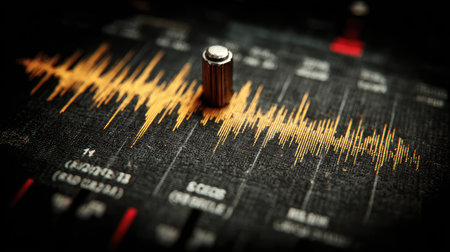
This striking waveform visualization showcases vibrant orange and yellow patterns emerging from a dark background, illustrating sound frequencies in an artistic manner.
Коллекция по умолчанию
Коллекция по умолчанию
Создать новую
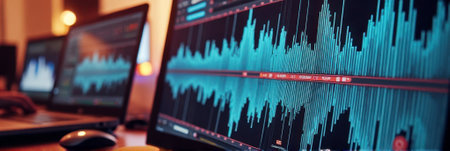
Red seismic waves pulsating on a dark monitoring screen indicate ongoing earthquake activity, providing crucial real time data for geologists and researchers
Коллекция по умолчанию
Коллекция по умолчанию
Создать новую
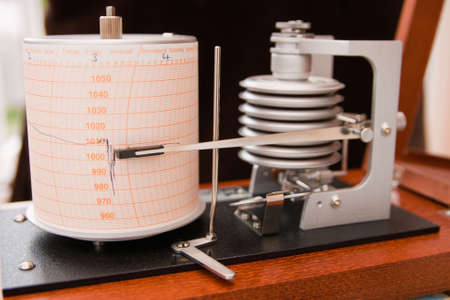
Barograph in a wooden box with the lid open
Коллекция по умолчанию
Коллекция по умолчанию
Создать новую
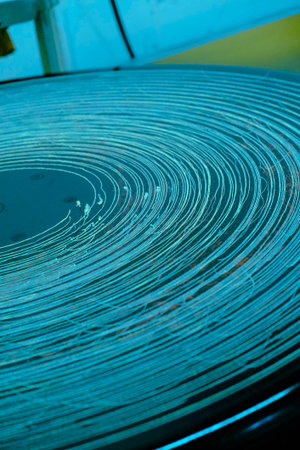
Close-up shot of wooden texture showcases the mesmerizing rings and grooves formed over years. The natural colors blend harmoniously, highlighting the beauty of wood. This unique design captures the essence of nature's craftmanship.
Коллекция по умолчанию
Коллекция по умолчанию
Создать новую
Legion-Media
Создайте свои проекты на основе качественных стоковых фотографий и видео.


Copyright © Legion-Media.