

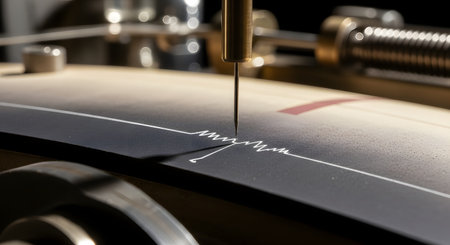
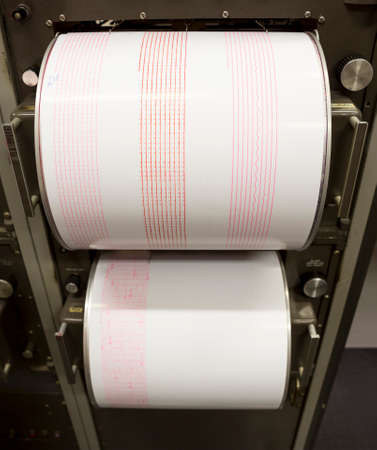
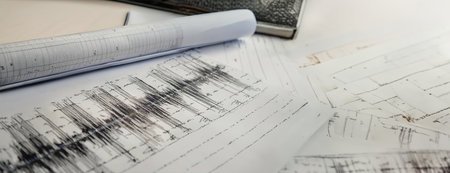
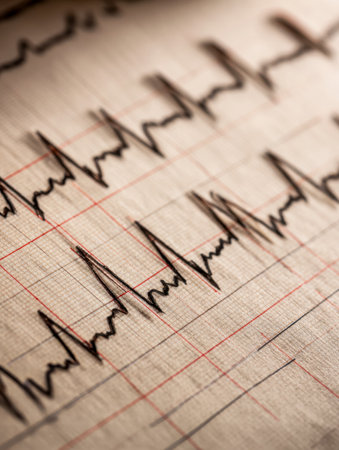
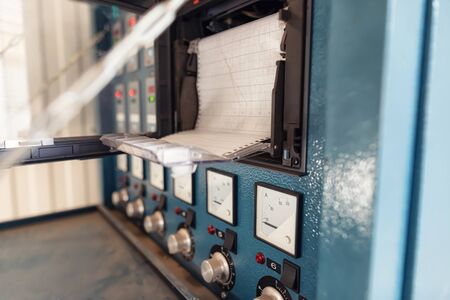
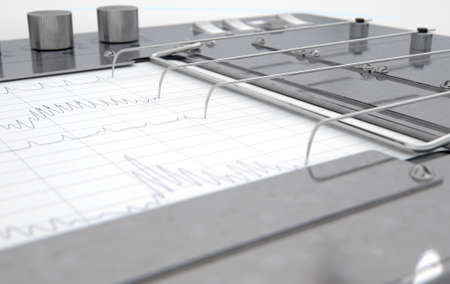
Paper comes out of an printing monitoring device
Коллекция по умолчанию
Коллекция по умолчанию
Создать новую

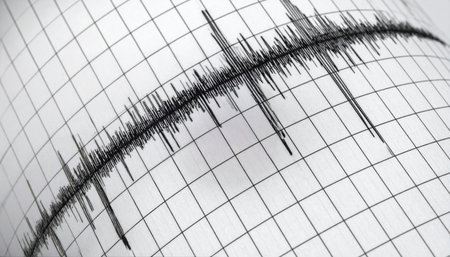
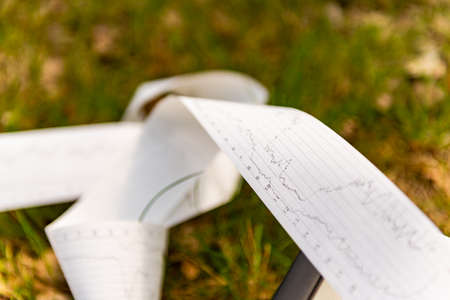
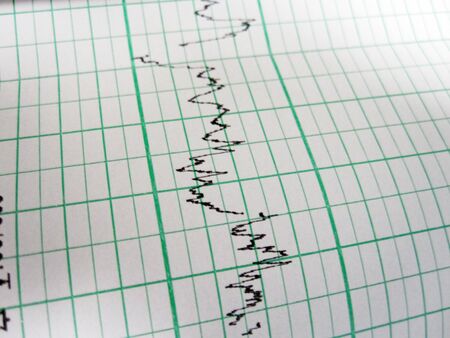
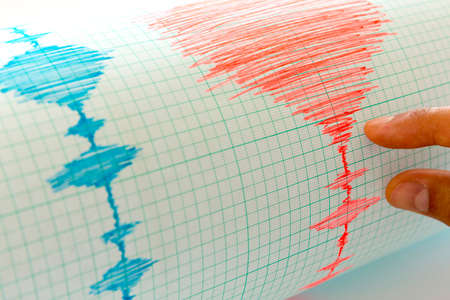
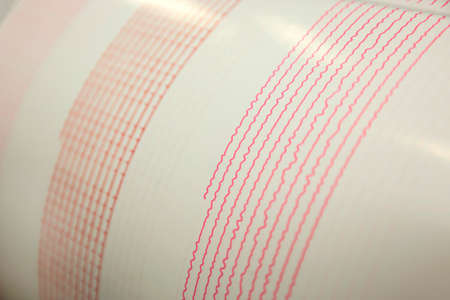
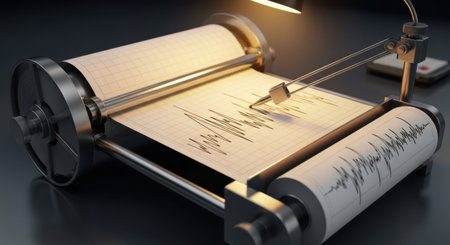
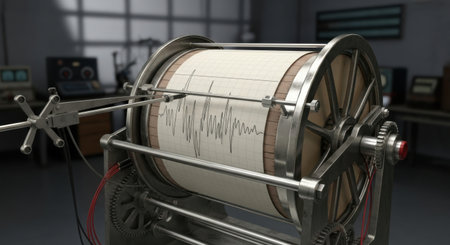
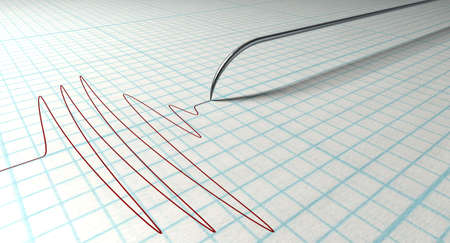
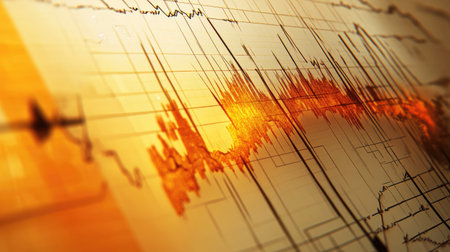
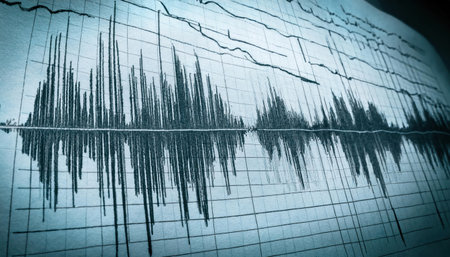
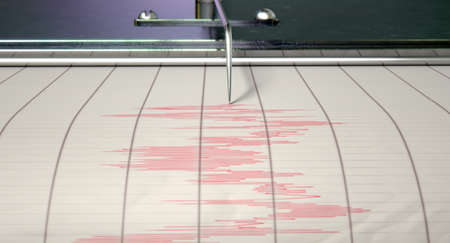
Seismograph records an earthquake on the sheet of measuring paper. Seismological device for measuring earthquakes. Seismograph machine needle drawing a red line on graph paper measuring activity.
Коллекция по умолчанию
Коллекция по умолчанию
Создать новую
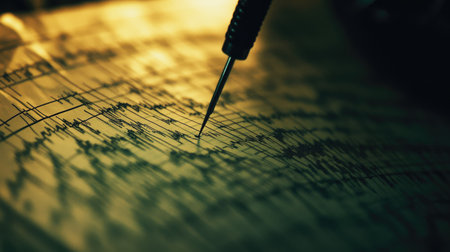
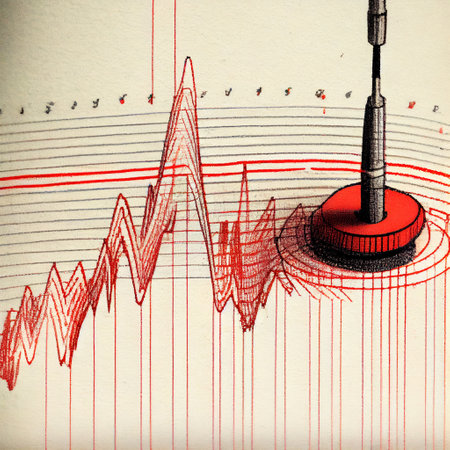
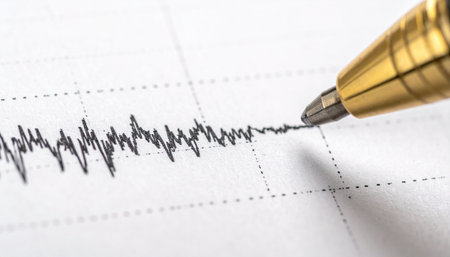
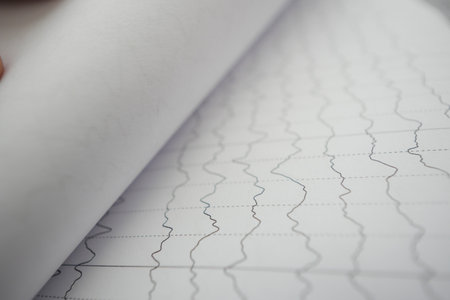
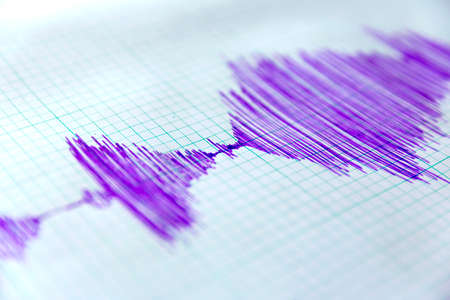
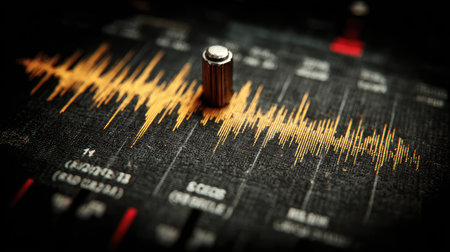
A detailed close-up of a seismograph machine with a fine needle drawing a jagged seismic wave on a moving paper. The image highlights the precise and intricate process of scientific measurement and the recording of earth movements.
Коллекция по умолчанию
Коллекция по умолчанию
Создать новую

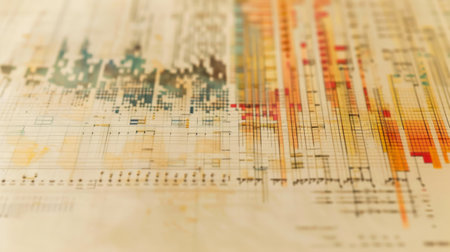
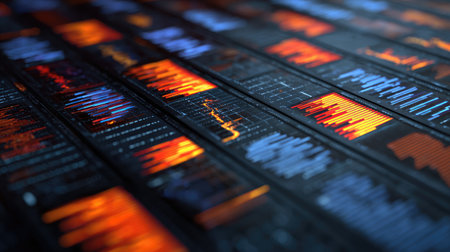
Radiated emissions spectrogram with limit lines in EMC electromagnetic compatibility test report
Коллекция по умолчанию
Коллекция по умолчанию
Создать новую
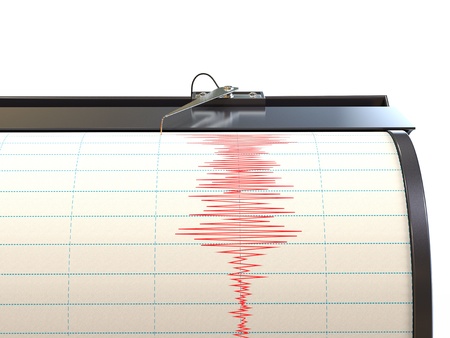
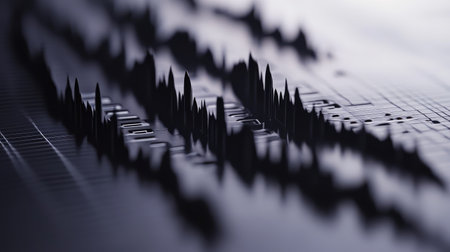
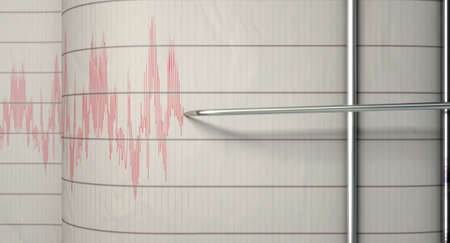
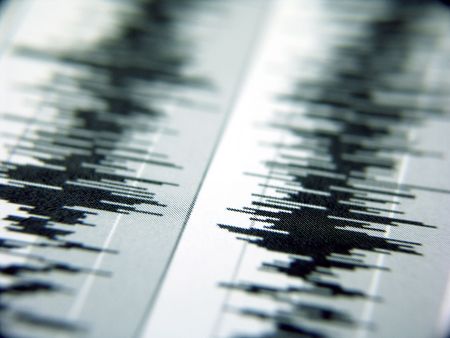
Detailed close-up view of a seismograph needle actively measuring earthquake activity, showcasing intricate patterns on a scientifically significant chart.
Коллекция по умолчанию
Коллекция по умолчанию
Создать новую
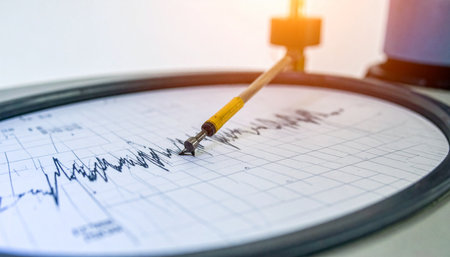
A sensitive needle meticulously traces the earth's powerful tremors onto a seismogram, capturing the raw data of a seismic event.
Коллекция по умолчанию
Коллекция по умолчанию
Создать новую
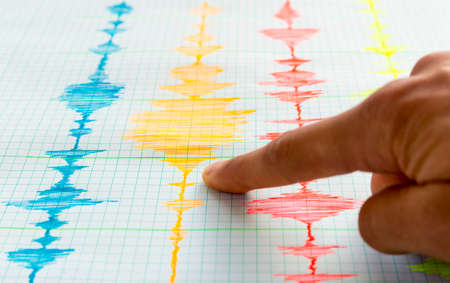
Seismological device for measuring earthquakes. Seismological activity live on the sheet of measuring paper.
Коллекция по умолчанию
Коллекция по умолчанию
Создать новую
Seismograph paper with a bold earthquake wave line showing seismic activity.
Коллекция по умолчанию
Коллекция по умолчанию
Создать новую
Lie detector or seismograph for earthquake detection. Generative Ai
Коллекция по умолчанию
Коллекция по умолчанию
Создать новую
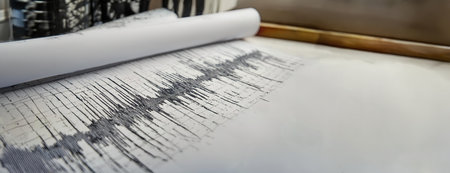
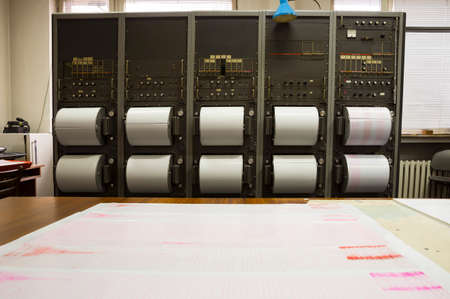
Seismograph printout showing seismic activity lines on a rolling paper with equipment in the background, illustrating the scientific monitoring of earthquake activity and data analysis
Коллекция по умолчанию
Коллекция по умолчанию
Создать новую
Electrocardiogram on blue background, close-up.
Коллекция по умолчанию
Коллекция по умолчанию
Создать новую

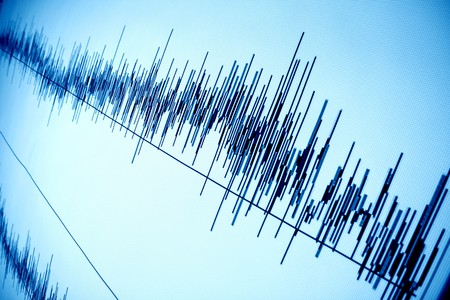
Seismological device for measuring earthquakes. Seismological activity live on the sheet of measuring paper. Earthquake wave on graph paper.
Коллекция по умолчанию
Коллекция по умолчанию
Создать новую
notebook pages with close up lines, used for writing data
Коллекция по умолчанию
Коллекция по умолчанию
Создать новую

Seismograph printout showing seismic activity lines on a rolling paper with equipment in the background, illustrating the scientific monitoring of earthquake activity and data analysis
Коллекция по умолчанию
Коллекция по умолчанию
Создать новую
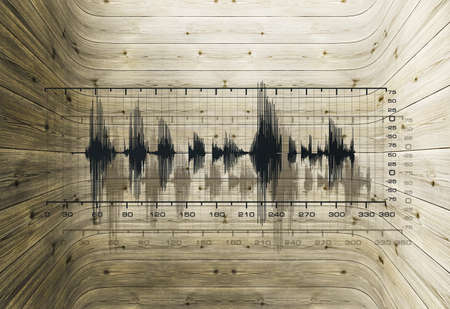
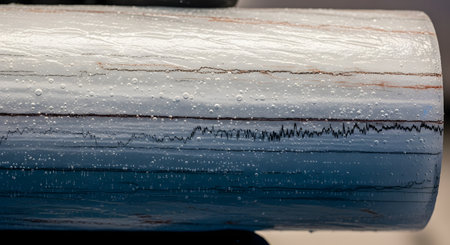
Checking wood for rotten areas. A special device for analyzing the tree for its health. The device outputs all the data for each millimeter of the tree trunk.
Коллекция по умолчанию
Коллекция по умолчанию
Создать новую

Seismological device for measuring earthquakes. Seismological activity live on the sheet of measuring paper.
Коллекция по умолчанию
Коллекция по умолчанию
Создать новую
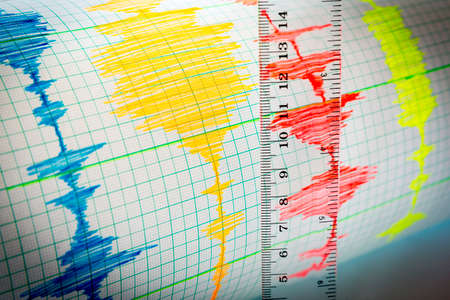
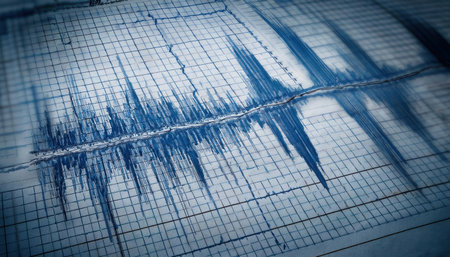
Seismological device for measuring earthquakes. Seismological activity lines on the sheet of measuring paper. Earthquake wave on graph paper. Vignette image. Ruler.
Коллекция по умолчанию
Коллекция по умолчанию
Создать новую
A close-up view captures the critical moment as a seismograph's needle meticulously records the earth's tremors.
Коллекция по умолчанию
Коллекция по умолчанию
Создать новую
Seismograph records an earthquake on the sheet of measuring paper. Seismological device for measuring earthquakes. Seismograph machine needle drawing a red line on graph paper measuring activity.
Коллекция по умолчанию
Коллекция по умолчанию
Создать новую
Charting medical data on unmarked graph paper
Коллекция по умолчанию
Коллекция по умолчанию
Создать новую
Seismograph records an earthquake on the sheet of measuring paper. Seismological device for measuring earthquakes. Seismograph machine needle drawing a red line on graph paper measuring activity.
Коллекция по умолчанию
Коллекция по умолчанию
Создать новую
Seismograph instrument recording ground motion during earthquake
Коллекция по умолчанию
Коллекция по умолчанию
Создать новую
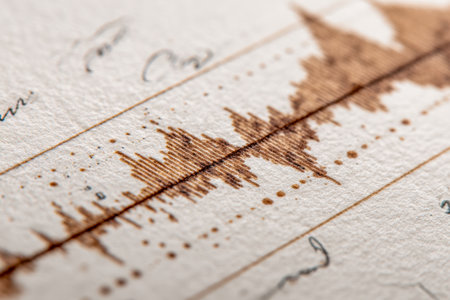
An antique seismograph sketch on coarse parchment, illustrating fluctuating wave patterns with handcrafted notes in rich sepia shades.
Коллекция по умолчанию
Коллекция по умолчанию
Создать новую

Close-up of a cardiogram with a syringe in a clinical setting. The image captures essential health monitoring elements, emphasizing the medical field.
Коллекция по умолчанию
Коллекция по умолчанию
Создать новую
detail of a graph of a fetus heatbeat
Коллекция по умолчанию
Коллекция по умолчанию
Создать новую
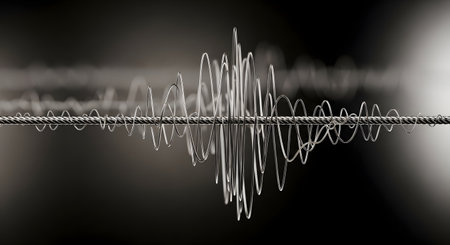
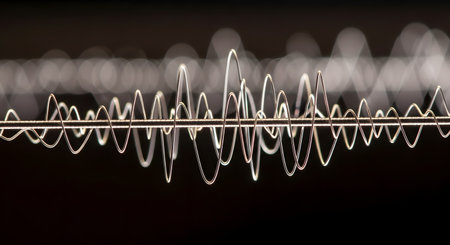
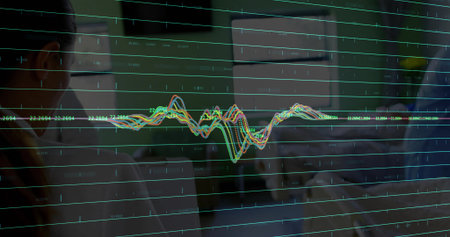
A monochromatic, abstract visualization of a complex soundwave or data signal traveling along a central twisted cable. The chaotic, wiry waveform represents concepts like communication, vibration, frequency, or the transmission of information. The shallow depth of field on a dark background creates a technical and artistic feel.
Коллекция по умолчанию
Коллекция по умолчанию
Создать новую
Seismological device for measuring earthquakes. Seismological activity live on the sheet of measuring paper. Earthquake wave on graph paper.
Коллекция по умолчанию
Коллекция по умолчанию
Создать новую

Seismological device for measuring earthquakes. Seismological activity live on the sheet of measuring paper.
Коллекция по умолчанию
Коллекция по умолчанию
Создать новую

This striking image features an abstract representation of sound waves and audio frequencies, showcasing vibrant colors and intricate graphical elements.
Коллекция по умолчанию
Коллекция по умолчанию
Создать новую

Seismograph instrument recording ground motion during earthquake
Коллекция по умолчанию
Коллекция по умолчанию
Создать новую
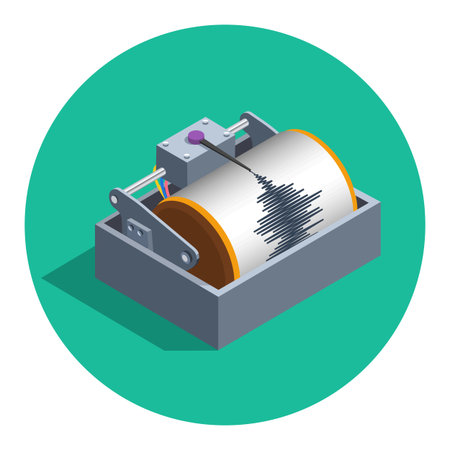
Earthquake analog seismograph isolated in circle flat color vector illustration, isometric style flat seismometer recording tool icon teaser
Коллекция по умолчанию
Коллекция по умолчанию
Создать новую
Seismological device for measuring earthquakes. Seismological activity live on the sheet of measuring paper.
Коллекция по умолчанию
Коллекция по умолчанию
Создать новую
Seismological device for measuring earthquakes. Seismological activity live on the sheet of measuring paper. Earthquake wave on graph paper.
Коллекция по умолчанию
Коллекция по умолчанию
Создать новую
This abstract image showcases sound waves as they depict audio frequency patterns with sharp peaks and valleys, creating a modern visual representation.
Коллекция по умолчанию
Коллекция по умолчанию
Создать новую
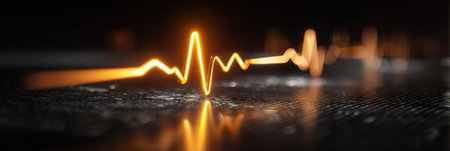
A vivid pulse line glows in warm orange tones, reflecting off a smooth surface, illustrating energy and rhythm in a dark setting.
Коллекция по умолчанию
Коллекция по умолчанию
Создать новую

Seismological device for measuring earthquakes. Seismological activity live on the sheet of measuring paper. Earthquake wave on graph paper.
Коллекция по умолчанию
Коллекция по умолчанию
Создать новую
Seismological device for measuring earthquakes. Seismological activity red line on the sheet of measuring paper. Earthquake wave on graph paper.
Коллекция по умолчанию
Коллекция по умолчанию
Создать новую
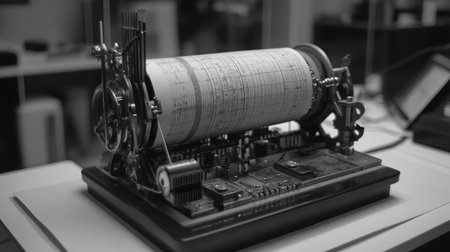
This black and white image captures a vintage mechanical instrument designed for recording data on a paper roll, showcasing intricate details and craftsmanship.
Коллекция по умолчанию
Коллекция по умолчанию
Создать новую
Geologist using a drafting compass drawing seismic waves expanding from the epicenter of an earthquake on a topographic map, studying geology and seismology
Коллекция по умолчанию
Коллекция по умолчанию
Создать новую
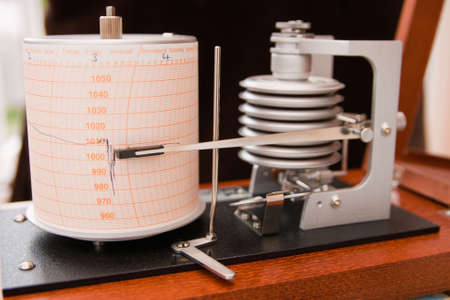
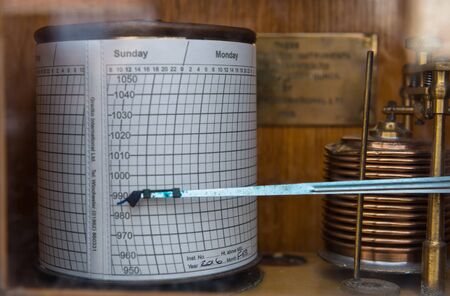
Barograph in a wooden box with the lid open
Коллекция по умолчанию
Коллекция по умолчанию
Создать новую

This abstract image showcases vibrant audio waves in orange and yellow tones, emphasizing sound analysis and modern data visualization techniques in a creative format.
Коллекция по умолчанию
Коллекция по умолчанию
Создать новую
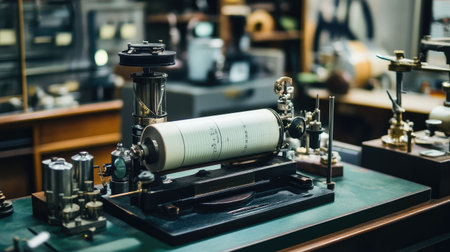
A vintage analytical instrument showcasing a paper cylinder in an authentic historical workshop setting. Perfect for themes of innovation and nostalgia.
Коллекция по умолчанию
Коллекция по умолчанию
Создать новую

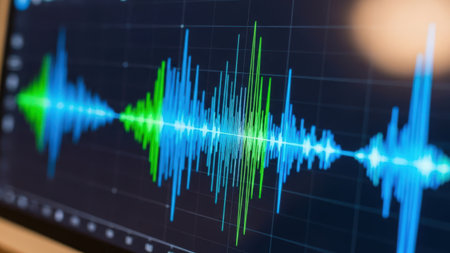
Sound recording studio audio wave on computer screen in professional editing program for voice, vocal, dj deejay musical mixing
Коллекция по умолчанию
Коллекция по умолчанию
Создать новую
A detailed view of a classic seismograph machine capturing tremors and vibrations on a continuous paper roll.
Коллекция по умолчанию
Коллекция по умолчанию
Создать новую
A closeup of a seismograph machine needle drawing a red line on graph paper depicting seismic and eartquake activity - 3D render
Коллекция по умолчанию
Коллекция по умолчанию
Создать новую
Earthquake blueprints and sketches rolled out on a table, showing detailed magnitude with focus on lines and measurements..
Коллекция по умолчанию
Коллекция по умолчанию
Создать новую

Seismograph data of a large earthquake. Seismic waves on the report page. 3D illustration.
Коллекция по умолчанию
Коллекция по умолчанию
Создать новую
This image showcases a vibrant digital waveform set against a circular background, symbolizing data analysis and sound frequency in modern technology.
Коллекция по умолчанию
Коллекция по умолчанию
Создать новую
A detailed view of an audio waveform, likely from a recording or sound analysis, displayed on a digital interface.
Коллекция по умолчанию
Коллекция по умолчанию
Создать новую
sound audio wave abstract background
Коллекция по умолчанию
Коллекция по умолчанию
Создать новую

Red seismic wave over Myanmar map
Коллекция по умолчанию
Коллекция по умолчанию
Создать новую

Seismological device for measuring earthquakes. Seismological activity lines on the sheet of measuring paper. Earthquake wave on graph paper. Vignette image. Human finger showing a detail.
Коллекция по умолчанию
Коллекция по умолчанию
Создать новую
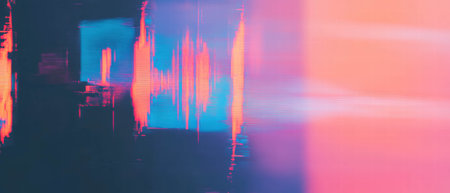
Glitch texture creating abstract patterns in distorted digital noise
Коллекция по умолчанию
Коллекция по умолчанию
Создать новую
A close-up view of an antique seismograph with a paper roll displaying recorded earth tremors.
Коллекция по умолчанию
Коллекция по умолчанию
Создать новую

World Earthquake Map, Fault Lines, Epicenters, and Seismic Activity
Коллекция по умолчанию
Коллекция по умолчанию
Создать новую
waveform in stereo created in audio editing program
Коллекция по умолчанию
Коллекция по умолчанию
Создать новую

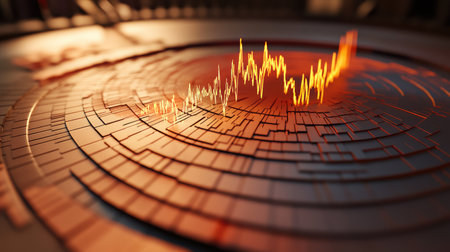
Stunning abstract artwork showcasing a dynamic data trend visualization with vibrant colors in a circular pattern, symbolizing growth and innovation.
Коллекция по умолчанию
Коллекция по умолчанию
Создать новую
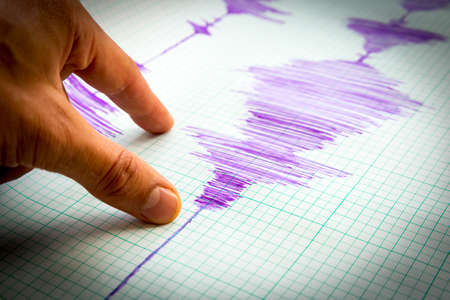
Seismological device for measuring earthquakes. Seismological activity lines on the sheet of measuring paper. Earthquake wave on graph paper. Vignette image. Human finger showing a detail.
Коллекция по умолчанию
Коллекция по умолчанию
Создать новую
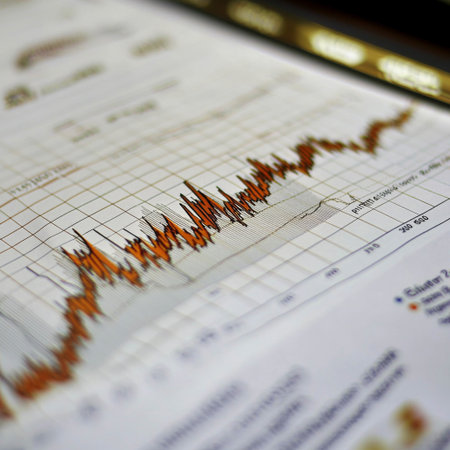
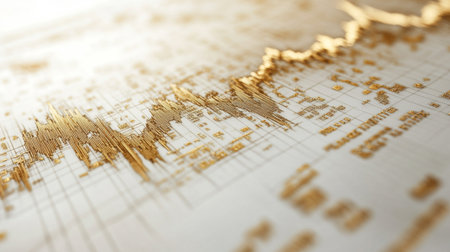
A luxury-themed financial report page with a gold line graph and stock market indicators
Коллекция по умолчанию
Коллекция по умолчанию
Создать новую
A closeup of a polygraph lie detector test needledrawing a red line on graph paper on an isolated white background
Коллекция по умолчанию
Коллекция по умолчанию
Создать новую

digital waveform on screen, music background. recording concept
Коллекция по умолчанию
Коллекция по умолчанию
Создать новую

Audio sound wave studio editing computer program screen showings sounds on screen from vocal recording of voiceover.
Коллекция по умолчанию
Коллекция по умолчанию
Создать новую
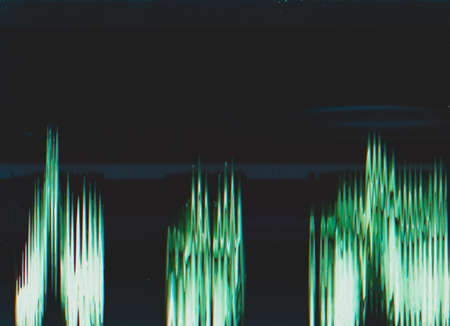
Glitch background. Digital or analog error. Green artifacts on dark teal blue empty space.
Коллекция по умолчанию
Коллекция по умолчанию
Создать новую
Delicious Dessert Pistachio Baklava
Коллекция по умолчанию
Коллекция по умолчанию
Создать новую
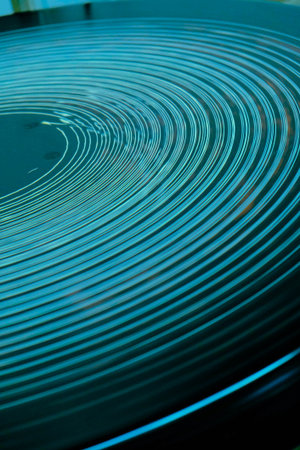
Uneven frequencies in a closed cavity made of wood
Коллекция по умолчанию
Коллекция по умолчанию
Создать новую
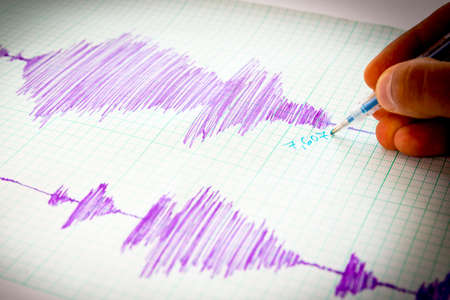
Seismological device for measuring earthquakes. Seismological activity lines on the sheet of measuring paper. Earthquake wave on graph paper. Vignette image. Human hand writing down with a blue pen.
Коллекция по умолчанию
Коллекция по умолчанию
Создать новую
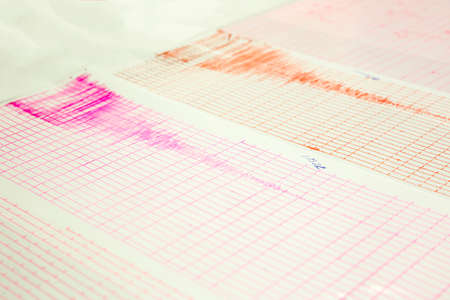
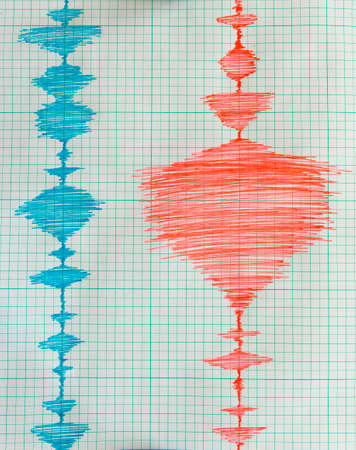
Seismological device for measuring earthquakes. Seismological activity live on the sheet of measuring paper. Earthquake wave on a graph paper. Red and purple lines from seismograph's needles.
Коллекция по умолчанию
Коллекция по умолчанию
Создать новую
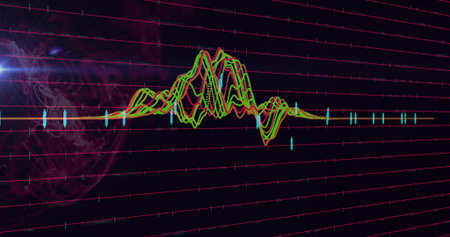
Displaying neon-colored waveforms undulating with sphere and cyan bars over magenta grid lines. Futuristic, digital, abstract, data, technology, visualization, neon
Коллекция по умолчанию
Коллекция по умолчанию
Создать новую

Explore a vintage mechanical cylinder record player showcasing intricate engineering and design. This historical artifact highlights the evolution of sound technology.
Коллекция по умолчанию
Коллекция по умолчанию
Создать новую
Vibrant waves traverse a crisp paper backdrop, embodying the rhythm of life and evoking a sense of healthcare innovation and vitality.
Коллекция по умолчанию
Коллекция по умолчанию
Создать новую
A close-up view of a gold price chart with intricate details, including percentage changes and key metrics, highlighted against a clean, white background.
Коллекция по умолчанию
Коллекция по умолчанию
Создать новую

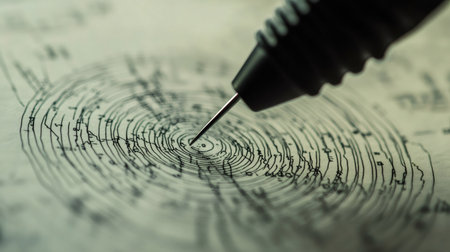
A detailed close-up of a seismograph in action, showcasing a pen recording earthquake vibrations on graph paper, highlighting scientific exploration in geology.
Коллекция по умолчанию
Коллекция по умолчанию
Создать новую
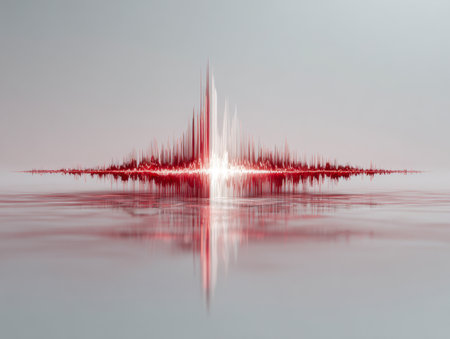
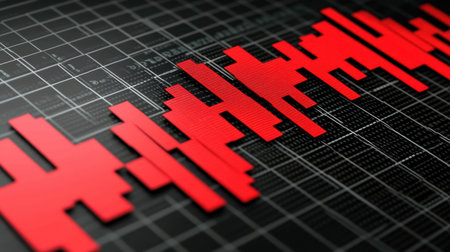
Vibrant red and white digital patterns ripple across a glossy surface, creating a striking symmetry with bold vertical peaks set against a soft gray backdrop.
Коллекция по умолчанию
Коллекция по умолчанию
Создать новую
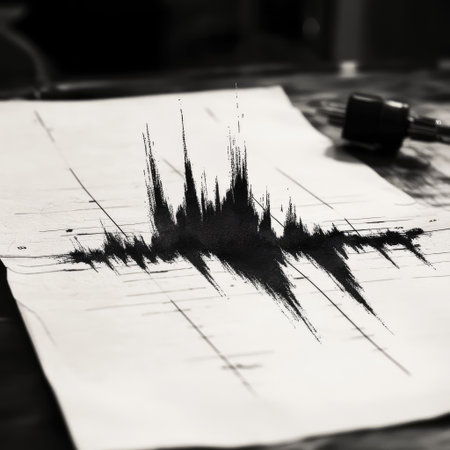
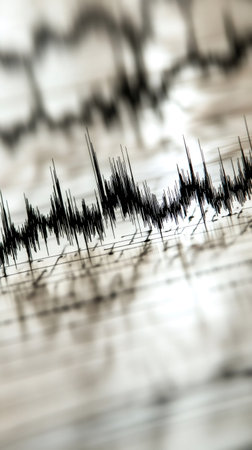
Artistic black and white representation of a sound wave on paper, featuring measuring instruments that convey scientific research and analysis concepts.
Коллекция по умолчанию
Коллекция по умолчанию
Создать новую
Control panel with instruments and chart recorder apparatus for heat treatment of welded joints
Коллекция по умолчанию
Коллекция по умолчанию
Создать новую
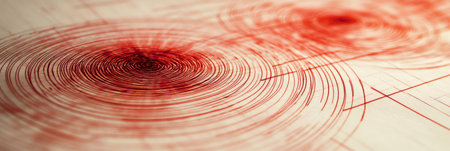
Red concentric circles represent seismic waves spreading from the epicenter of an earthquake, creating a visual representation of geological activity and ground shaking
Коллекция по умолчанию
Коллекция по умолчанию
Создать новую

Earthquake. Richter Earthquake Magnitude Scale. Vector illustration. EPS 10
Коллекция по умолчанию
Коллекция по умолчанию
Создать новую

Seismic activity earthquake New Mexico map Richter scale
Коллекция по умолчанию
Коллекция по умолчанию
Создать новую

Sound recording studio audio wave on computer screen in professional editing program for voice, vocal, dj deejay musical mixing
Коллекция по умолчанию
Коллекция по умолчанию
Создать новую
A detailed bar graph plotted on graph paper, demonstrating meticulous data analysis and visualization techniques.
Коллекция по умолчанию
Коллекция по умолчанию
Создать новую
This abstract image showcases vibrant audio waves in orange and yellow tones, emphasizing sound analysis and modern data visualization techniques in a creative format.
Коллекция по умолчанию
Коллекция по умолчанию
Создать новую
A close-up, macro photograph of a cylindrical ice core sample, revealing distinct layers and ancient air bubbles trapped within. This image represents scientific climate research, environmental history, and the study of polar ice.
Коллекция по умолчанию
Коллекция по умолчанию
Создать новую
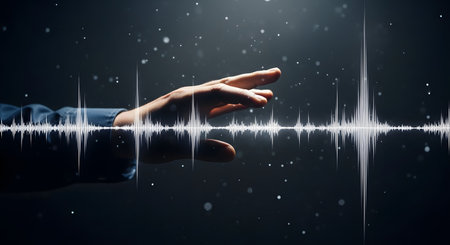
A human hand reaches out and interacts with a glowing digital audio waveform against a dark, futuristic background with floating particles. This conceptual image represents sound technology, voice recognition, audio engineering, and the digital world.
Коллекция по умолчанию
Коллекция по умолчанию
Создать новую
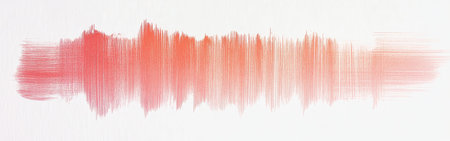
Pencil strokes are applied with varying pressure, creating a gradient effect that transitions from bold, vibrant red to lighter, subtler shades. This artistic technique showcases skillful blending.
Коллекция по умолчанию
Коллекция по умолчанию
Создать новую
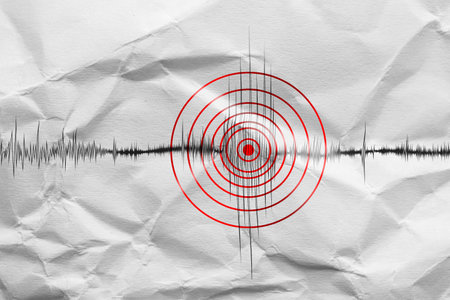
Earthquake marked with red circles on seismogram. Graph from seismometer
Коллекция по умолчанию
Коллекция по умолчанию
Создать новую
A close-up view of an audio spectrum displayed on a computer screen. The waveform shows a combination of blue and green lines, indicating different frequencies and amplitudes of the audio signal. The graph is detailed with grid lines for precise measurement.
Коллекция по умолчанию
Коллекция по умолчанию
Создать новую
financial chart on the monitor as a concept of financial crisis and recession
Коллекция по умолчанию
Коллекция по умолчанию
Создать новую
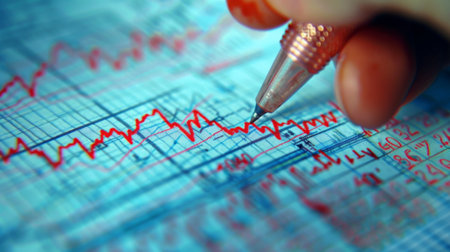
A close-up of a hand drawing trend lines and annotations on a financial graph, depicting analysis and forecasting
Коллекция по умолчанию
Коллекция по умолчанию
Создать новую
Seismograph displaying detailed seismic wave patterns, recording ground movement and measuring earthquake intensity with precise scientific instrumentation
Коллекция по умолчанию
Коллекция по умолчанию
Создать новую
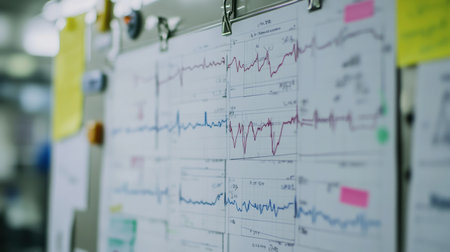
A collection of medical graphs and charts displayed on a clinic wall depicting various data readings. This image captures the essence of data-driven healthcare analysis.
Коллекция по умолчанию
Коллекция по умолчанию
Создать новую
A 3D render of a polygraph lie detector machine drawing red lines on graph paper
Коллекция по умолчанию
Коллекция по умолчанию
Создать новую
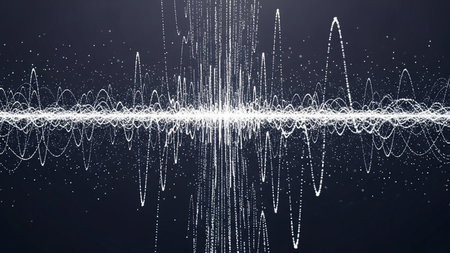
A visualization of a sound wave made of white glowing particles and lines against a dark background.
Коллекция по умолчанию
Коллекция по умолчанию
Создать новую
Vibrant digital glitch effect showcasing contrasting hues and dynamic colors
Коллекция по умолчанию
Коллекция по умолчанию
Создать новую
A business graph on a digital screen shows downward trends in red, indicating financial losses.
Коллекция по умолчанию
Коллекция по умолчанию
Создать новую
A closeup of a seismograph machine needle drawing a red line on graph paper depicting seismic and eartquake activity - 3D render
Коллекция по умолчанию
Коллекция по умолчанию
Создать новую
A captivating abstract visualization featuring vibrant colors to illustrate data trends and analytical patterns, emphasizing technology's role in modern analytics.
Коллекция по умолчанию
Коллекция по умолчанию
Создать новую
An abstract visualization of a soundwave or digital signal, rendered as a glowing, oscillating line against a dark background. Out-of-focus bokeh lights add depth to the image, which represents concepts like audio, frequency, communication, data, and modern technology.
Коллекция по умолчанию
Коллекция по умолчанию
Создать новую
Close up of old seismograph machine with wooden case and copper wiring on display
Коллекция по умолчанию
Коллекция по умолчанию
Создать новую
Displaying color chart on glass, tracking trends in dim office with labels and colleagues in shirts. Data, analytics, visualization, dashboard, meeting, collaboration, monitors
Коллекция по умолчанию
Коллекция по умолчанию
Создать новую
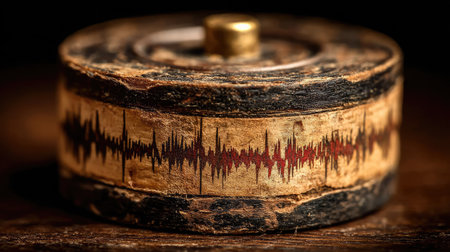
A close-up shot of an old wooden container with a unique sound wave pattern carved into its side.
Коллекция по умолчанию
Коллекция по умолчанию
Создать новую
Legion-Media
Создайте свои проекты на основе качественных стоковых фотографий и видео.


Copyright © Legion-Media.