

A colorful pie chart casts striking shadows on a surface, showcasing modern design and vibrant colors. Ideal for business or creative visualizations.
Коллекция по умолчанию
Коллекция по умолчанию
Создать новую

Colorful fraction circles arranged into a circle graph and hand, black background.
Коллекция по умолчанию
Коллекция по умолчанию
Создать новую

3d pie chart showcasing business data percentages, set against a seamless gradient background
Коллекция по умолчанию
Коллекция по умолчанию
Создать новую
This image features a colorful segmented circle design against a dark background, perfect for creative projects, educational materials, or graphic designs.
Коллекция по умолчанию
Коллекция по умолчанию
Создать новую

Stats concept with wood pie chart
Коллекция по умолчанию
Коллекция по умолчанию
Создать новую

pie chart divided into slices to represent different aspects of innovation within a business concept, such as product, process, and service innovation.
Коллекция по умолчанию
Коллекция по умолчанию
Создать новую

A vibrant pie chart displayed on a wooden surface, showcasing various colors divided into sections. Perfect for visualizing data in reports or presentations.
Коллекция по умолчанию
Коллекция по умолчанию
Создать новую

A high-resolution image of a rotating 3D pie chart, highlighting financial performance metrics with clear, labeled sections and a neutral backdrop.
Коллекция по умолчанию
Коллекция по умолчанию
Создать новую

A creative pie chart with textured segments showing sales data, each slice representing a different product line, set against a rustic wooden table background.
Коллекция по умолчанию
Коллекция по умолчанию
Создать новую

Graph of market share with black pen in business concept
Коллекция по умолчанию
Коллекция по умолчанию
Создать новую

Colorful pie chart on wooden table, representing data visualization and analysis..
Коллекция по умолчанию
Коллекция по умолчанию
Создать новую

A visually appealing pie chart made of pastel colors against a soft blue background, perfect for educational materials, presentations, and creative projects.
Коллекция по умолчанию
Коллекция по умолчанию
Создать новую

A colorful financial pie chart showing market shares, with labeled sections representing stocks, bonds, and investments, displayed on a white background with clean lines.
Коллекция по умолчанию
Коллекция по умолчанию
Создать новую

A vibrant pie chart displayed on a report demonstrates clear data analysis. Ideal for business presentations and financial insights in a professional setting.
Коллекция по умолчанию
Коллекция по умолчанию
Создать новую

A vibrant pie chart model featuring colorful segments on a glass table. Ideal for educational, business, and creative presentations to illustrate concepts effectively.
Коллекция по умолчанию
Коллекция по умолчанию
Создать новую

A macro shot of a pie chart in a presentation slide, capturing the distinct slices and their labels with a professional backdrop.
Коллекция по умолчанию
Коллекция по умолчанию
Создать новую

A close-up of a colorful business pie chart with segmented sections, showcasing data distribution and a clean, professional design.
Коллекция по умолчанию
Коллекция по умолчанию
Создать новую

Colorful pie chart with vibrant segments displayed on a table, ideal for showcasing data analysis and business presentations in a creative and engaging manner.
Коллекция по умолчанию
Коллекция по умолчанию
Создать новую
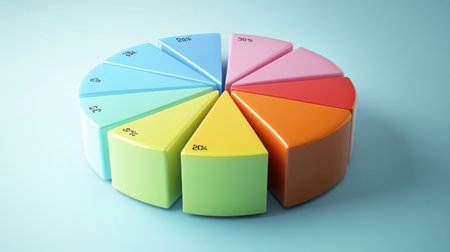
A minimalistic pie chart with pastel-colored slices representing different budget categories, displayed on a light background with percentages clearly labeled for easy understanding.
Коллекция по умолчанию
Коллекция по умолчанию
Создать новую

A detailed shot of a D pie chart with segmented sections and labels, displaying data in a visually engaging and three-dimensional format.
Коллекция по умолчанию
Коллекция по умолчанию
Создать новую

Close-up of colorful pie chart segments resting on a wooden surface. This image illustrates data representation and visual analysis concepts for various applications.
Коллекция по умолчанию
Коллекция по умолчанию
Создать новую

A colorful financial pie chart showing market shares, with labeled sections representing stocks, bonds, and investments, displayed on a white background with clean lines.
Коллекция по умолчанию
Коллекция по умолчанию
Создать новую

A pie chart diagram on a whiteboard during a team meeting, with markers and eraser nearby.
Коллекция по умолчанию
Коллекция по умолчанию
Создать новую

A vibrant pie chart displayed on a table, surrounded by office supplies and documents, illustrating business analysis and data visualization concepts.
Коллекция по умолчанию
Коллекция по умолчанию
Создать новую

A pie chart with vibrant colors and business growth indicators
Коллекция по умолчанию
Коллекция по умолчанию
Создать новую

A pie chart infographic on a poster board, visually representing statistical analysis
Коллекция по умолчанию
Коллекция по умолчанию
Создать новую
A colorful pie chart representation on a minimalist backdrop, ideal for data analysis, presentations, and business visuals, showcasing insights and metrics.
Коллекция по умолчанию
Коллекция по умолчанию
Создать новую

Vibrant paper segments arranged on a dark surface showcase creativity and modern design, ideal for business and educational presentations or artistic projects.
Коллекция по умолчанию
Коллекция по умолчанию
Создать новую

A creative pie chart with textured segments showing sales data, each slice representing a different product line, set against a rustic wooden table background.
Коллекция по умолчанию
Коллекция по умолчанию
Создать новую

A vibrant pie chart on a light surface, perfect for business presentations, data analysis, or creative projects, showcasing colorful segments for visual impact.
Коллекция по умолчанию
Коллекция по умолчанию
Создать новую

A vibrant pie chart model featuring pastel shades, elegantly placed on a white table, perfect for illustrating data visualization concepts in educational or business contexts.
Коллекция по умолчанию
Коллекция по умолчанию
Создать новую

A close-up of a pie chart illustrating market share distribution, with percentages highlighted for each segment.
Коллекция по умолчанию
Коллекция по умолчанию
Создать новую

This vibrant paper pie chart features six segments in various colors, set against a blue background, ideal for business presentations or educational materials.
Коллекция по умолчанию
Коллекция по умолчанию
Создать новую

Pie charts representing diversified stock portfolios, diversification of investment or asset allocation on stock and fund and bond make investments more efficient
Коллекция по умолчанию
Коллекция по умолчанию
Создать новую

A colorful paper pie chart showcases pastel hues on a minimalist background, creating an engaging visual representation of data and creativity.
Коллекция по умолчанию
Коллекция по умолчанию
Создать новую
Colorful 3D pie chart on a pastel green background representing business analytics, data visualization, market share, and financial growth.
Коллекция по умолчанию
Коллекция по умолчанию
Создать новую

A pie chart illustrating the breakdown of consumer spending habits in different demographic groups
Коллекция по умолчанию
Коллекция по умолчанию
Создать новую

A minimalistic pie chart with pastel-colored slices representing different budget categories, displayed on a light background with percentages clearly labeled for easy understanding.
Коллекция по умолчанию
Коллекция по умолчанию
Создать новую

An AI generated illustration of project management graphs charts paper
Коллекция по умолчанию
Коллекция по умолчанию
Создать новую

A colorful D pie chart with slices that appear to pop out, set against a contrasting background, showcasing data segments in a visually engaging way.
Коллекция по умолчанию
Коллекция по умолчанию
Создать новую

A colorful pie chart with distinct segments in gradient colors, arranged on a white background with soft shadows for a clean financial analysis look
Коллекция по умолчанию
Коллекция по умолчанию
Создать новую

A pie chart breakdown of sector allocations in an investment portfolio, highlighting diversification strategies.
Коллекция по умолчанию
Коллекция по умолчанию
Создать новую

This vibrant pie chart on a blue background visually represents data segments with bright colors. Ideal for business, education, and marketing presentations.
Коллекция по умолчанию
Коллекция по умолчанию
Создать новую

Detailed graphs and charts displayed on paper capture vital business metrics and analysis, showcasing data-driven insights for strategic planning and informed decision-making.
Коллекция по умолчанию
Коллекция по умолчанию
Создать новую

This colorful pie chart illustration features segments in various hues on a soft blue background, perfect for use in business, marketing, or creative presentations.
Коллекция по умолчанию
Коллекция по умолчанию
Создать новую

This modern 3D pie chart features vibrant teal and orange sections ideal for illustrating data insights in financial, business, or educational presentations.
Коллекция по умолчанию
Коллекция по умолчанию
Создать новую

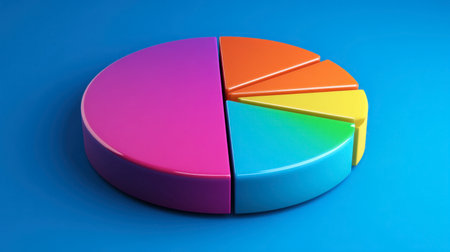
A vibrant pie chart composed of four sections in blue, red, yellow, and orange, set against a soft yellow background, ideal for marketing and educational materials.
Коллекция по умолчанию
Коллекция по умолчанию
Создать новую

Detailed shot of a 3D pie chart with a shadowed effect, showing detailed breakdowns of data in a visually appealing and informative format.
Коллекция по умолчанию
Коллекция по умолчанию
Создать новую

A colorful pie chart segment displayed on a dark surface. The vibrant colors and geometric shapes create a modern and artistic look, ideal for educational or business visuals.
Коллекция по умолчанию
Коллекция по умолчанию
Создать новую

This colorful 3D pie chart features a segmented design, showcasing vibrant colors and playful shapes. Ideal for visual presentations or data analysis.
Коллекция по умолчанию
Коллекция по умолчанию
Создать новую

Close-up view of a 3D pie chart with segments highlighted in different shades, showing detailed labels and percentages for clear data representation.
Коллекция по умолчанию
Коллекция по умолчанию
Создать новую

Bright 3d pie chart on top of a blurred financial report, symbolizing data analysis
Коллекция по умолчанию
Коллекция по умолчанию
Создать новую

Analyzing pie chart, closeup, office setting, strategic planning
Коллекция по умолчанию
Коллекция по умолчанию
Создать новую

A vibrant, colorful pie chart set against a soft pink background. Ideal for business presentations, data analysis, or creative projects that need a modern touch.
Коллекция по умолчанию
Коллекция по умолчанию
Создать новую

A charming hand-drawn pastel pie chart with chalk-textured shading on a rustic wooden background. Surrounding it are scattered paper bills, representing creative financial planning and approachable economic concepts.
Коллекция по умолчанию
Коллекция по умолчанию
Создать новую

A simple, clear pie chart illustrating household financial planning, with different categories for savings, bills, and leisure, presented on a clean white surface.
Коллекция по умолчанию
Коллекция по умолчанию
Создать новую

Woman holding business reports
Коллекция по умолчанию
Коллекция по умолчанию
Создать новую

A vibrant wooden pie chart with sections in blue, orange, and green rests on a colorful, abstract art surface, showcasing concepts of data representation and analysis.
Коллекция по умолчанию
Коллекция по умолчанию
Создать новую

A vibrant pie chart model showcasing various colors, ideal for data visualization in educational or professional settings. Wooden table background enhances the presentation.
Коллекция по умолчанию
Коллекция по умолчанию
Создать новую
A vibrant pie chart set against a blue background, ideal for illustrating data analysis, statistics, and business presentations. Perfect for digital graphics.
Коллекция по умолчанию
Коллекция по умолчанию
Создать новую

A vibrant pie chart composed of colorful segments set against a soft blue background, perfect for educational and business presentations, showcasing data visualization.
Коллекция по умолчанию
Коллекция по умолчанию
Создать новую
Colorful pie chart model showcases different segments on a dark background, ideal for educational and business presentations to visualize data clearly.
Коллекция по умолчанию
Коллекция по умолчанию
Создать новую

A vibrant pie chart sits atop a background filled with various financial graphs and charts. The pie chart features segments of blue, yellow, pink, orange, and gray. The image showcases a bright color palette, soft lighting, and an illustrative style, suitable for business and commercial applications.
Коллекция по умолчанию
Коллекция по умолчанию
Создать новую

A colorful pie chart featuring vibrant segments against a bright background, ideal for data visualization, educational materials, or marketing strategies in presentations.
Коллекция по умолчанию
Коллекция по умолчанию
Создать новую

drawing with chalk on a blackboard
Коллекция по умолчанию
Коллекция по умолчанию
Создать новую

Vibrant and colorful charts and graphs illustrating data analysis, showcasing insights for business and marketing strategies in a professional context.
Коллекция по умолчанию
Коллекция по умолчанию
Создать новую

A detailed shot of a D pie chart with labeled segments and a shadow effect, creating a visually appealing and informative representation of statistical data.
Коллекция по умолчанию
Коллекция по умолчанию
Создать новую

A vibrant pie chart illustrates financial data, perfect for planners and consultants. Ideal for presentations showcasing statistics and insights in business strategy.
Коллекция по умолчанию
Коллекция по умолчанию
Создать новую

Colorful pie chart in the foreground with blurred business meeting in the background
Коллекция по умолчанию
Коллекция по умолчанию
Создать новую

A high-angle view of a 3D pie chart with labeled segments, placed on a desk alongside business documents and a laptop, symbolizing data analysis in a corporate setting.
Коллекция по умолчанию
Коллекция по умолчанию
Создать новую

A detailed shot of a printed pie chart on a desk, with vibrant segments representing different data categories and a calculator beside it.
Коллекция по умолчанию
Коллекция по умолчанию
Создать новую

A detailed view of a pie chart with 3D effects and shadows, illustrating business data with a modern and dynamic look.
Коллекция по умолчанию
Коллекция по умолчанию
Создать новую

A vibrant pie chart and graphs displayed on a wooden office desk, emphasizing data analysis and business insights in a professional workspace.
Коллекция по умолчанию
Коллекция по умолчанию
Создать новую

A vibrant pie chart displayed on a minimalist background, showcasing bright colors and geometric shapes, ideal for business presentations or data analysis.
Коллекция по умолчанию
Коллекция по умолчанию
Создать новую

A vibrant pie chart showcasing different colors against a soft background, ideal for business presentations, data analysis, or creative design projects.
Коллекция по умолчанию
Коллекция по умолчанию
Создать новую

A minimalist pie chart infographic on a white background with segmented sections in bold colors, representing market share data.
Коллекция по умолчанию
Коллекция по умолчанию
Создать новую

Close-up of a circular pie chart with distinct color sections, isolated on a light background, capturing a clean, modern data feel.
Коллекция по умолчанию
Коллекция по умолчанию
Создать новую

A vibrant pie chart rests on a tablet screen, showcasing data analysis. The soft blue background enhances the presentation of this modern business visual.
Коллекция по умолчанию
Коллекция по умолчанию
Создать новую

This vibrant 3D pie chart showcases data segmentation in various pastel colors, ideal for business presentations, marketing analytics, or financial reporting.
Коллекция по умолчанию
Коллекция по умолчанию
Создать новую

Colorful pie chart on a beige background. 3d render
Коллекция по умолчанию
Коллекция по умолчанию
Создать новую

Colorful circular shape pieces in yellow and red on a blue fabric surface create a vibrant abstract design. Ideal for creative and educational projects.
Коллекция по умолчанию
Коллекция по умолчанию
Создать новую

Vibrant pie chart visualization representing data analysis. Ideal for business presentations, reports, and infographics to enhance understanding of statistics and trends.
Коллекция по умолчанию
Коллекция по умолчанию
Создать новую

A close-up of a D pie chart displaying survey results, with distinct colors and shadowing, set on a wooden desk with subtle reflections for a professional touch.
Коллекция по умолчанию
Коллекция по умолчанию
Создать новую

A visually striking image of a D pie chart with segments popping out and a sleek, professional design, perfect for reports, presentations, or data analysis.
Коллекция по умолчанию
Коллекция по умолчанию
Создать новую

A vibrant detailed 3D pie chart against a soft pastel backdrop
Коллекция по умолчанию
Коллекция по умолчанию
Создать новую

A vibrant pie chart sits on a light blue table surrounded by office supplies, stationery items, and notes, perfect for business planning and creative projects.
Коллекция по умолчанию
Коллекция по умолчанию
Создать новую

High-resolution image of a D pie chart with gradient colors and glossy finish, presenting data with a polished and eye-catching appearance.
Коллекция по умолчанию
Коллекция по умолчанию
Создать новую

A high-angle view of a 3D pie chart with labeled segments, placed on a desk alongside business documents and a laptop, symbolizing data analysis in a corporate setting.
Коллекция по умолчанию
Коллекция по умолчанию
Создать новую

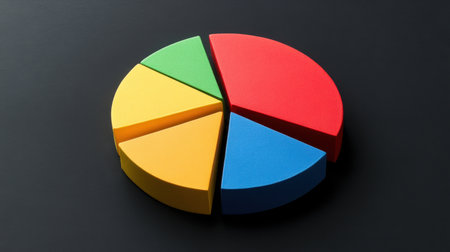
Pie Chart with Vibrant Sections on a Checkered Background.
Коллекция по умолчанию
Коллекция по умолчанию
Создать новую

Abstract blue and red pie chart infographic template symbol, profit, growth or information concept, 3D illustration
Коллекция по умолчанию
Коллекция по умолчанию
Создать новую

Vibrant 3D financial pie chart with glowing segments in bright, contrasting colors.
Коллекция по умолчанию
Коллекция по умолчанию
Создать новую
A rotating D pie chart with colorful, layered sections representing data, with numbers and labels floating beside each slice for clarity.
Коллекция по умолчанию
Коллекция по умолчанию
Создать новую

Colorful D pie chart with translucent segments, placed on a dark, reflective surface with soft lighting, symbolizing data visualization
Коллекция по умолчанию
Коллекция по умолчанию
Создать новую
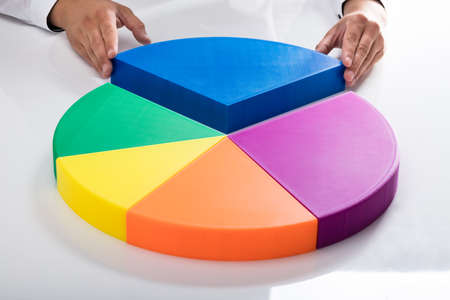
Human hand placing final blue piece into multi colored pie chart
Коллекция по умолчанию
Коллекция по умолчанию
Создать новую

A vibrant 3D pie chart designed with pastel colors, ideal for representing data distribution in business presentations, educational materials, or marketing efforts.
Коллекция по умолчанию
Коллекция по умолчанию
Создать новую

Colorful cycle diagram. Business concept. Red, yellow, pink and blue cycle diagram on bright blue background with copy space.
Коллекция по умолчанию
Коллекция по умолчанию
Создать новую

A colorful pie chart representing data analysis sits on a bright surface. The modern design highlights various segments, perfect for presentations.
Коллекция по умолчанию
Коллекция по умолчанию
Создать новую

A colorful pie chart divided into three segments, resting on a mint green background, symbolizing data representation and analysis.
Коллекция по умолчанию
Коллекция по умолчанию
Создать новую

A visual display of a pie chart alongside a line graph, showing diversified portfolio allocations and risk analysis for a financial investment strategy meeting.
Коллекция по умолчанию
Коллекция по умолчанию
Создать новую

A vibrant 3D pie chart with colorful segments floating above a digital screen, representing data analysis, with sleek reflections and dynamic lighting.
Коллекция по умолчанию
Коллекция по умолчанию
Создать новую
Legion-Media
Создайте свои проекты на основе качественных стоковых фотографий и видео.


Copyright © Legion-Media.