
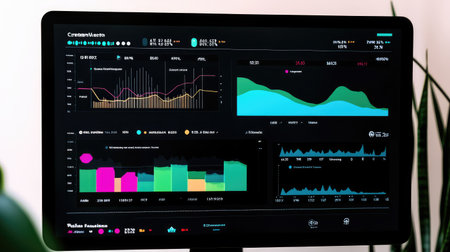
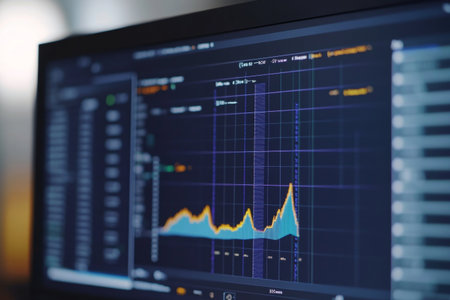
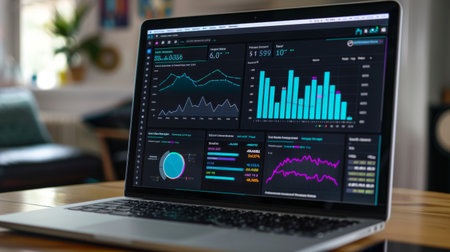
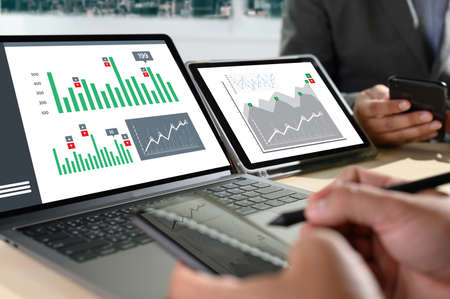
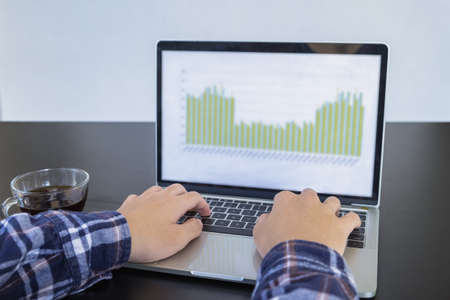
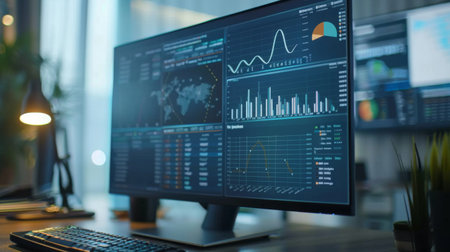
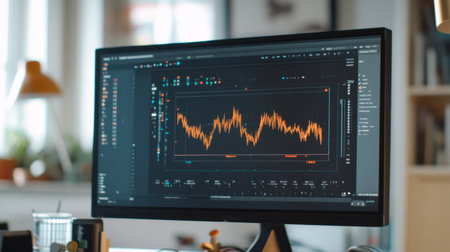
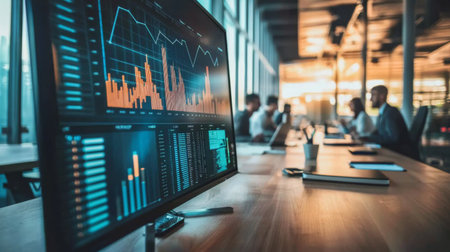
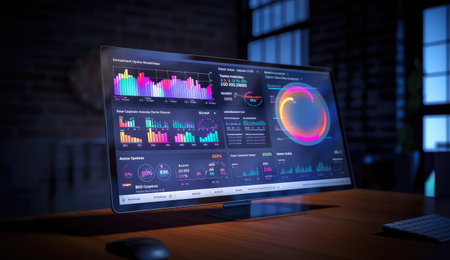
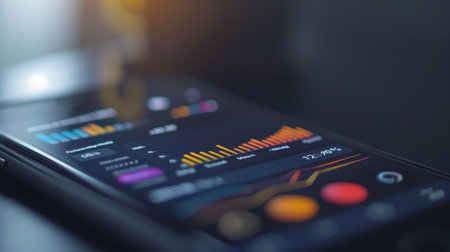
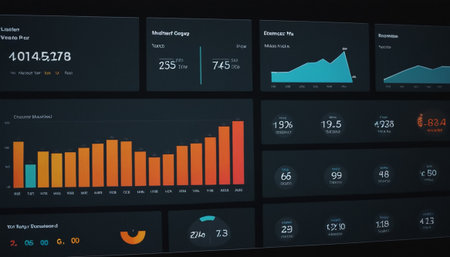
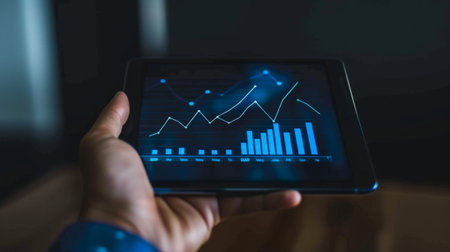
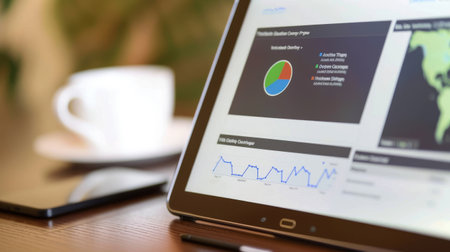
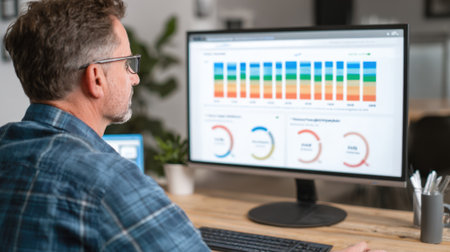
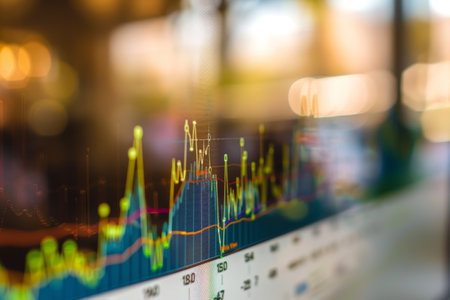
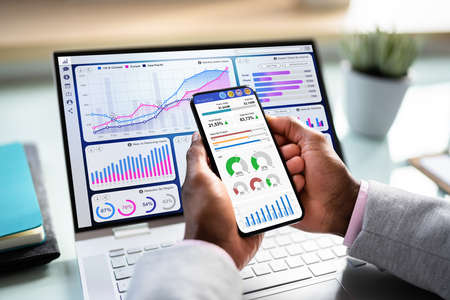
A close-up of a financial dashboard with growth charts and profit reports, providing space to add insights on economic growth, investment strategies, or market expansion
Коллекция по умолчанию
Коллекция по умолчанию
Создать новую
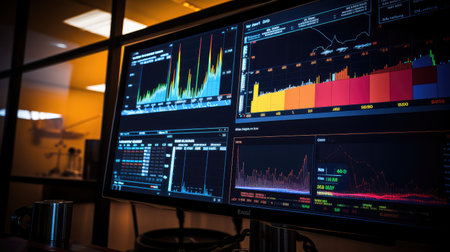
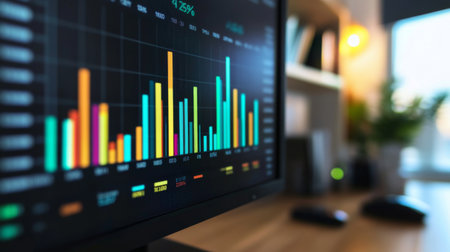
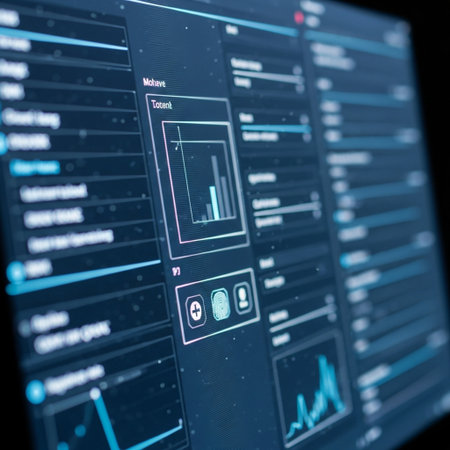
charts oil rig data
Коллекция по умолчанию
Коллекция по умолчанию
Создать новую
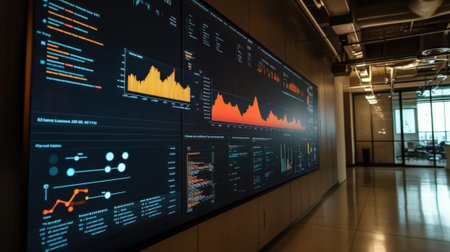
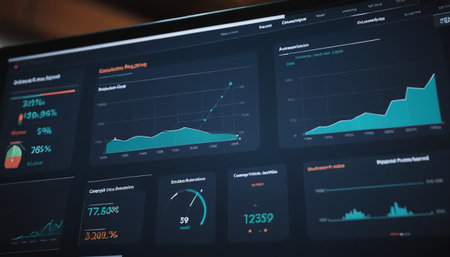
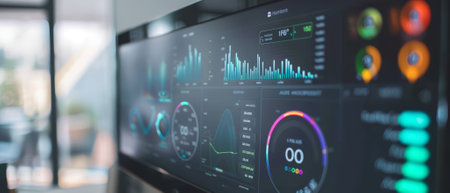
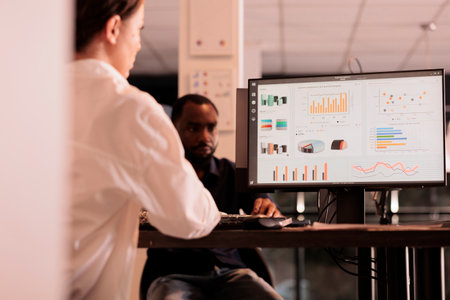
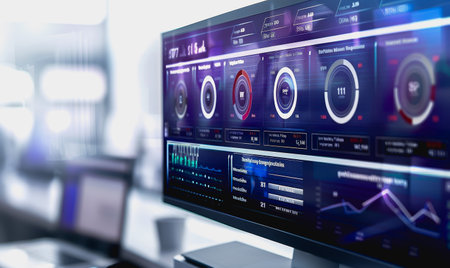
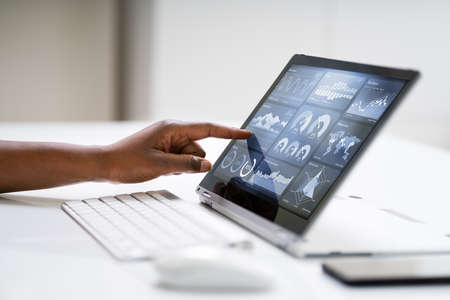
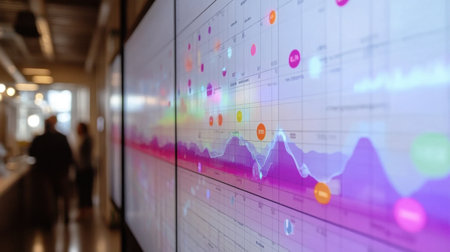
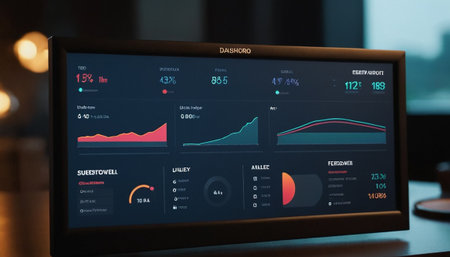
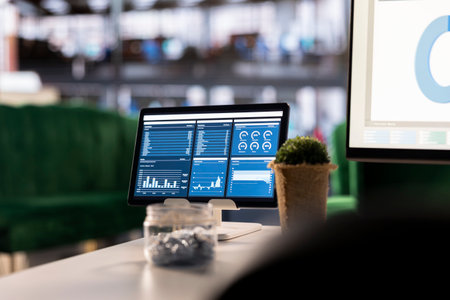
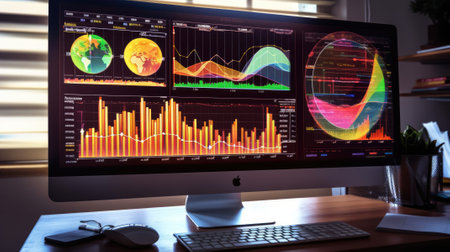
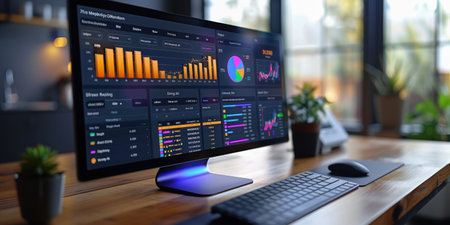
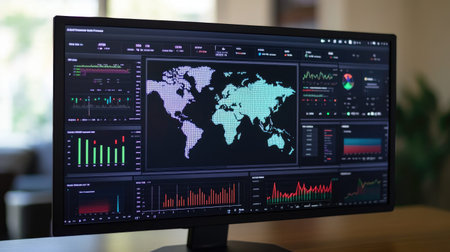
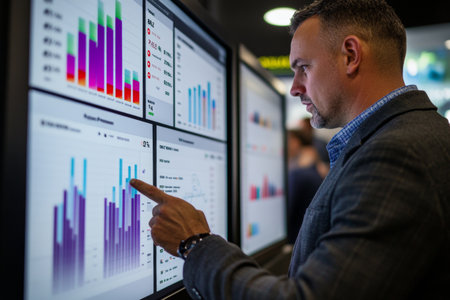
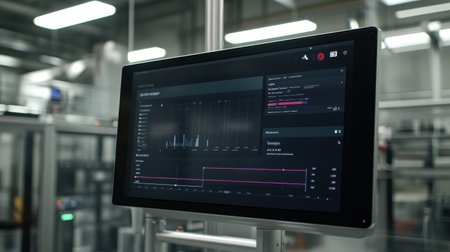
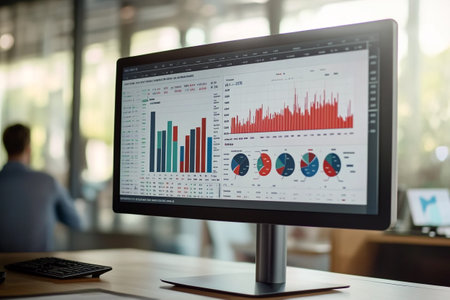
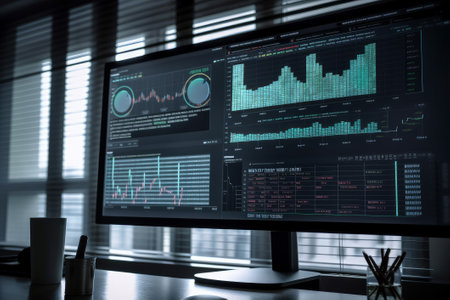
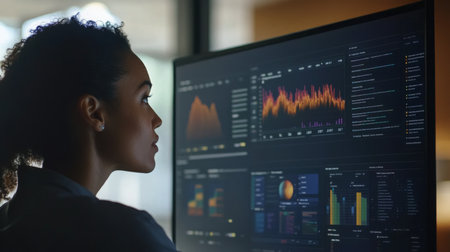
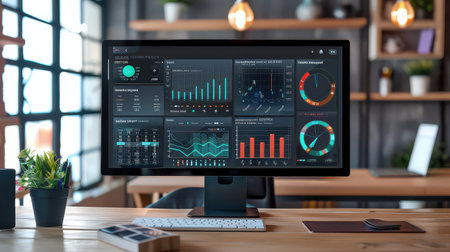
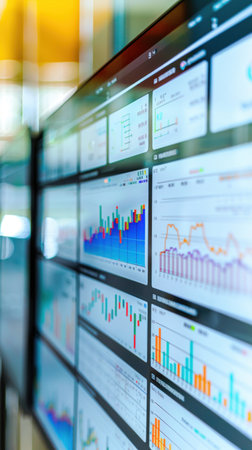
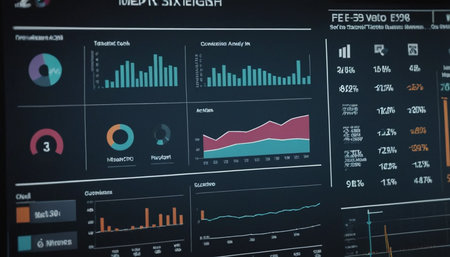
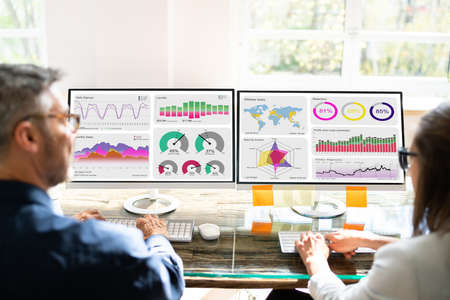
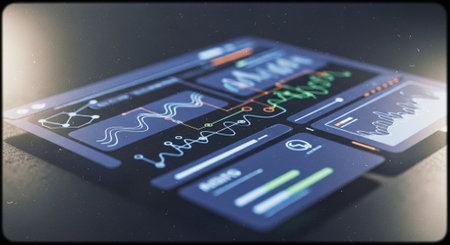
A focused shot of a large screen featuring realtime data visualization tools showcasing interactive segments filled with KPIs and metrics. The screen highlights areas of performanc
Коллекция по умолчанию
Коллекция по умолчанию
Создать новую
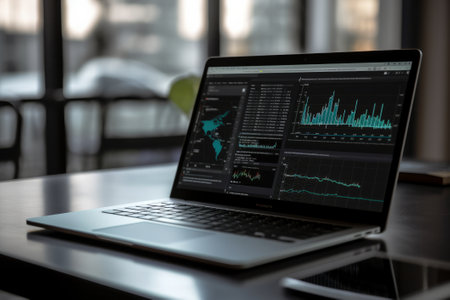
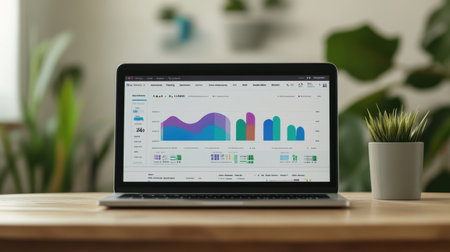
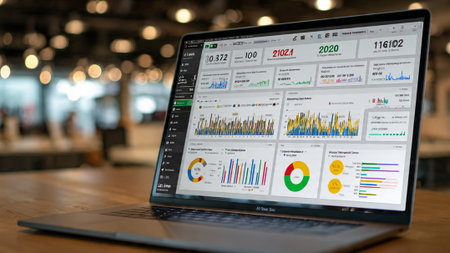
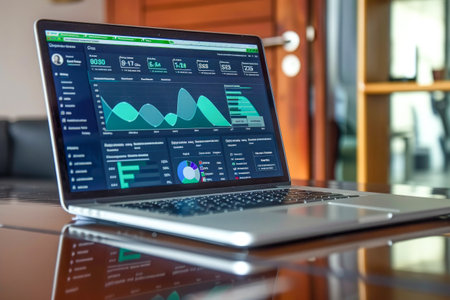
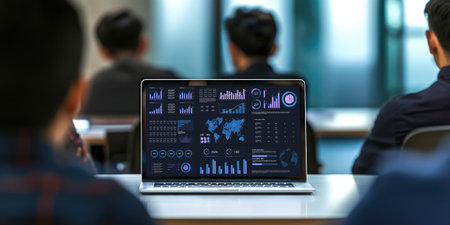
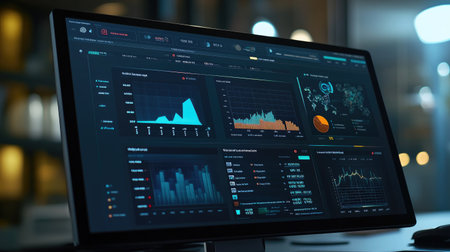
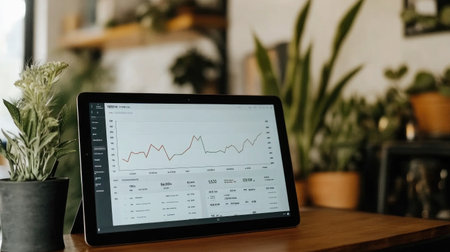
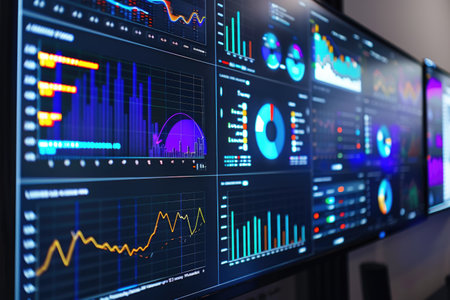
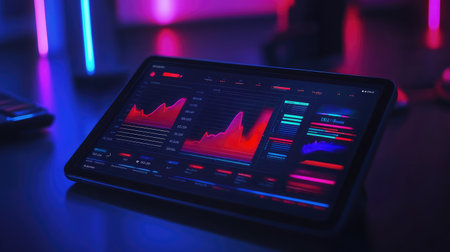
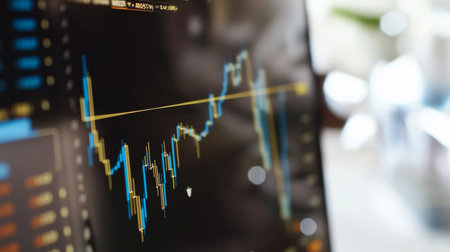
Laptop with the chart on screen. Business and finance concept
Коллекция по умолчанию
Коллекция по умолчанию
Создать новую
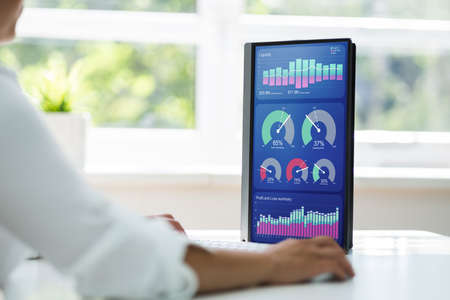
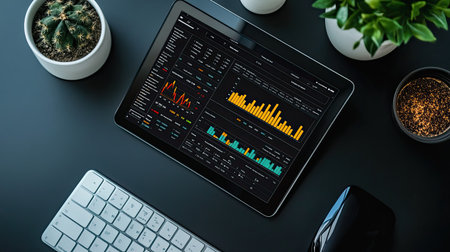
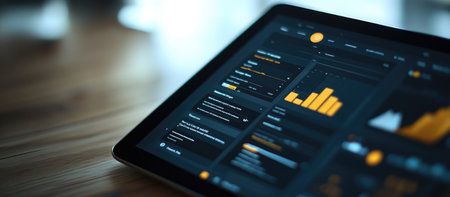
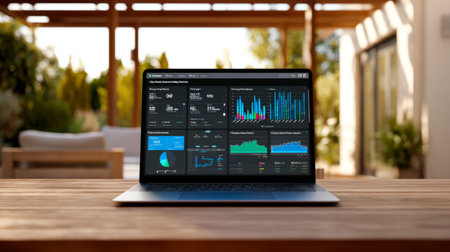
A close-up of a high-resolution computer screen reveals a detailed Python script focused on data cleaning and preprocessing techniques for data analysis.
Коллекция по умолчанию
Коллекция по умолчанию
Создать новую
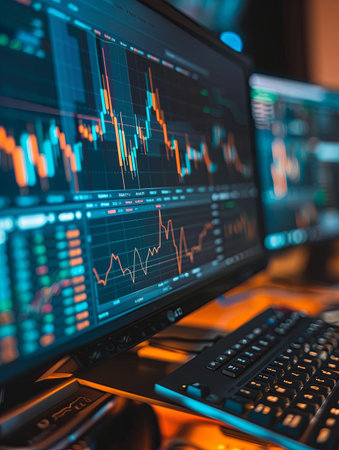
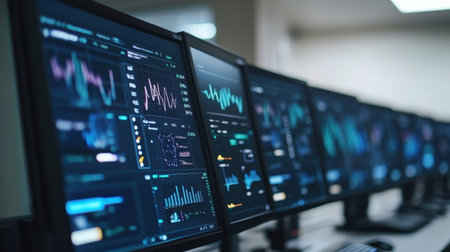
Stock market data on monitor screen. Abstract stock market data background. Stock market data on monitor screen. Business financial graph on monitor. Stock market data on monitor.
Коллекция по умолчанию
Коллекция по умолчанию
Создать новую

Shallow depth of field (selective focus) with details of a chart showing the stock market crash from March 2020 due to the Covid-19 pandemic on a computer screen (S&P500 index)
Коллекция по умолчанию
Коллекция по умолчанию
Создать новую
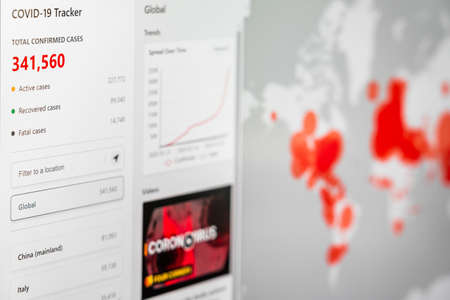
BUCHAREST, ROMANIA - MARCH 23, 2020: Coronavirus Total Cases Of The Pandemic Spreading All Around The Globe In March
Коллекция по умолчанию
Коллекция по умолчанию
Создать новую
Financial data analyzing on monitor. Abstract financial data analysis on monitor.
Коллекция по умолчанию
Коллекция по умолчанию
Создать новую
A detailed shot of a smart home dashboard monitoring energy and water usage, illustrating technology-driven sustainable living,
Коллекция по умолчанию
Коллекция по умолчанию
Создать новую
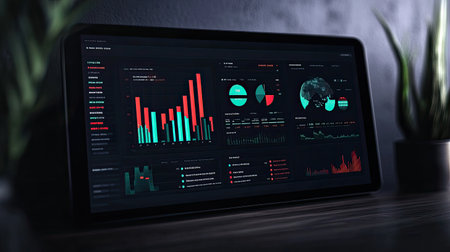
Shopee data dashboard showcasing trend indicators, sales performance, and pie charts on a dark interface, with ample room for copy.
Коллекция по умолчанию
Коллекция по умолчанию
Создать новую
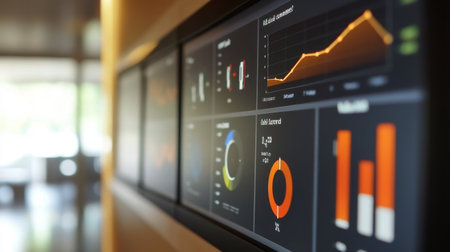
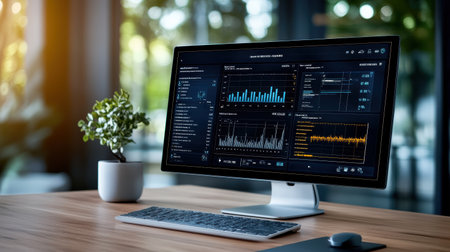
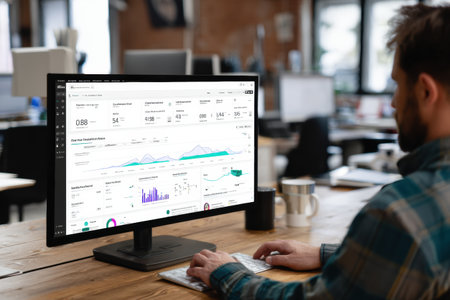
Modern data visualization displayed on a large screen showcases graphs and charts reflecting financial performance metrics in a contemporary office setting.
Коллекция по умолчанию
Коллекция по умолчанию
Создать новую
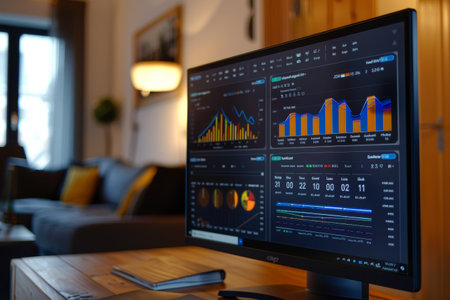
A monitor with a graph displayed on it is placed on a table in a living room, Incorporate interactive graphs and charts to visualize energy usage and cost savings
Коллекция по умолчанию
Коллекция по умолчанию
Создать новую

A close-up of a digital dashboard with rising investments, offering space for adding content about investment performance, growth, or risk management
Коллекция по умолчанию
Коллекция по умолчанию
Создать новую
Close-up of a laptop screen with a dashboard displaying various graphs and charts, highlighting data visualization
Коллекция по умолчанию
Коллекция по умолчанию
Создать новую
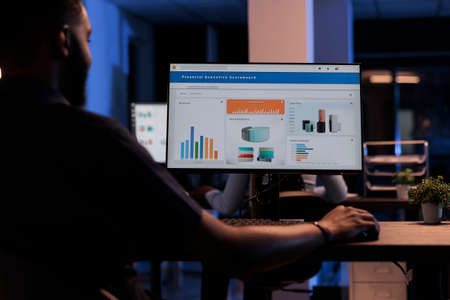
Employee analyzing company financial report dashboard on computer screen, woman working on business research statistics in coworking space, back view. Corporate worker checking analytics
Коллекция по умолчанию
Коллекция по умолчанию
Создать новую
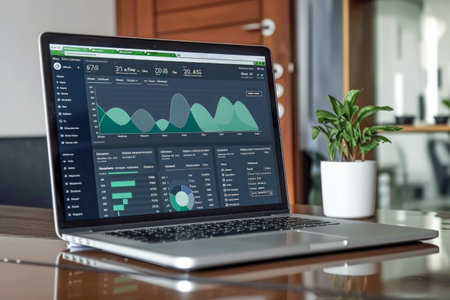
A sleek laptop shows vibrant data visualizations on its screen, surrounded by a serene workspace setting with a green plant, ideal for business and analytics projects.
Коллекция по умолчанию
Коллекция по умолчанию
Создать новую
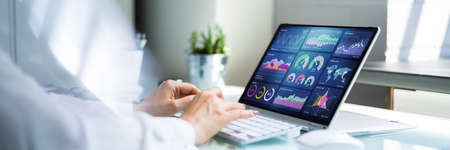
KPI Data Analyst Woman Using Computer With Graphs
Коллекция по умолчанию
Коллекция по умолчанию
Создать новую
work hard Data Analytics Statistics Information Business Technology
Коллекция по умолчанию
Коллекция по умолчанию
Создать новую
High-tech financial dashboard for inward remittance with hexagonal icons, blue-purple color scheme.
Коллекция по умолчанию
Коллекция по умолчанию
Создать новую
Close-up of a laptop screen displaying a business analytics dashboard, with data and charts.
Коллекция по умолчанию
Коллекция по умолчанию
Создать новую
Businessman tracks various orders using a comprehensive dashboard interface while seated at a contemporary desk in a bright office environment.
Коллекция по умолчанию
Коллекция по умолчанию
Создать новую
African Advisor Using KPI Dashboard With Financial Analytics Graphs
Коллекция по умолчанию
Коллекция по умолчанию
Создать новую
A modern digital health record interface displaying patient data and analytics
Коллекция по умолчанию
Коллекция по умолчанию
Создать новую

KPI Dashboard Data Analytics On Business Laptop
Коллекция по умолчанию
Коллекция по умолчанию
Создать новую
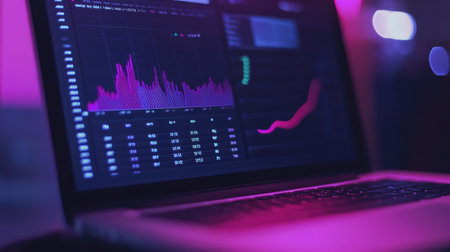
A focused view of a laptop displaying abstract financial data visualizations in a dim environment illuminated by purple lighting. Ideal for finance and tech visuals.
Коллекция по умолчанию
Коллекция по умолчанию
Создать новую

Glowing data charts displayed on a laptop signify analysis in a contemporary office setting during evening hours.
Коллекция по умолчанию
Коллекция по умолчанию
Создать новую
A computer monitor displaying financial charts and graphs sits on top of a wooden desk. Generative AI
Коллекция по умолчанию
Коллекция по умолчанию
Создать новую
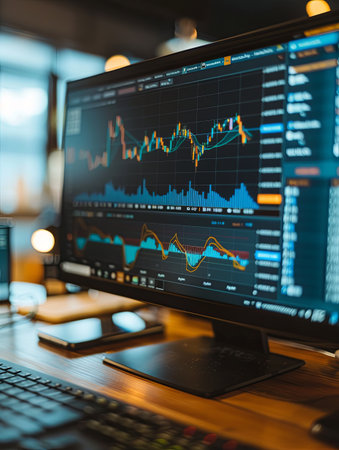
Detailed display on a stock trading terminal shows live market data, graphs, and trends in a financial setting, highlighting investment activity.
Коллекция по умолчанию
Коллекция по умолчанию
Создать новую
A close-up view of a digital dashboard showcasing various data visualizations. This image features colorful graphs and charts, ideal for illustrating analytics and performance insights in a modern workspace.
Коллекция по умолчанию
Коллекция по умолчанию
Создать новую
KPI Dashboard Data Analytics On Business Laptop
Коллекция по умолчанию
Коллекция по умолчанию
Создать новую
Stock market data on monitor. Financial graph on monitor. Stock market data on monitor. Stock market data on monitor. Business graph on monitor. Stock market data on monitor.
Коллекция по умолчанию
Коллекция по умолчанию
Создать новую

Business Data Analyst Man Using Computer At Desk
Коллекция по умолчанию
Коллекция по умолчанию
Создать новую
Learn online, Student watching lesson online and studying from home. Young man taking notes while looking at computer screen following professor on video call. Studying from home on pc.
Коллекция по умолчанию
Коллекция по умолчанию
Создать новую
Engaging view of colorful data visualization on a large screen in a modern office, illustrating key insights and trends for effective business decision making and strategic planning.
Коллекция по умолчанию
Коллекция по умолчанию
Создать новую
A focused professional observes colorful market data and trend graphs displayed on an advanced digital display, analyzing financial performance.
Коллекция по умолчанию
Коллекция по умолчанию
Создать новую
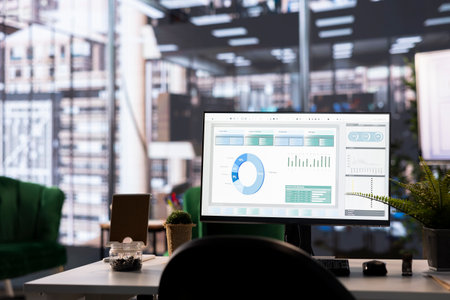
Modern office desk displays financial data on a monitor. The detailed analytics and graphs highlight business strategy and success, supported by data management and analysis tools.
Коллекция по умолчанию
Коллекция по умолчанию
Создать новую
A close-up of a computer monitor displaying a detailed business graph, with key metrics and indicators highlighted for analysis.
Коллекция по умолчанию
Коллекция по умолчанию
Создать новую

Rear View Of Young Businessman Looking At Graph On The Computers In The Office
Коллекция по умолчанию
Коллекция по умолчанию
Создать новую
Close-up view of laptop screen with graphs and charts on screen
Коллекция по умолчанию
Коллекция по умолчанию
Создать новую
A laptop displaying various data analysis graphs and charts on its screen
Коллекция по умолчанию
Коллекция по умолчанию
Создать новую
A minimalist workspace with a sleek tablet showing a simple yet informative business graph and key data points.
Коллекция по умолчанию
Коллекция по умолчанию
Создать новую
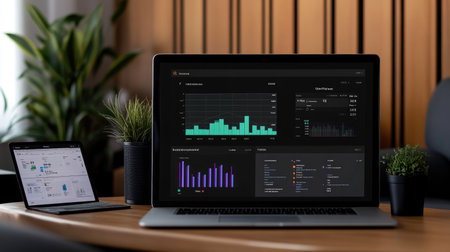
Executive workspace features a digital dashboard with financial charts and reports. This setup emphasizes productivity, data driven insights and planning for business growth and development.
Коллекция по умолчанию
Коллекция по умолчанию
Создать новую
A Line Graph Illustrates the Rewards of Long-Term Investment
Коллекция по умолчанию
Коллекция по умолчанию
Создать новую
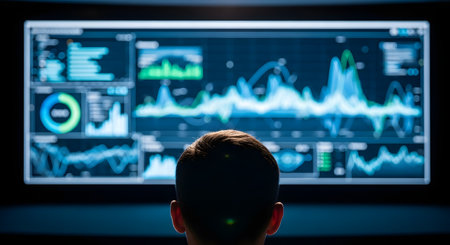
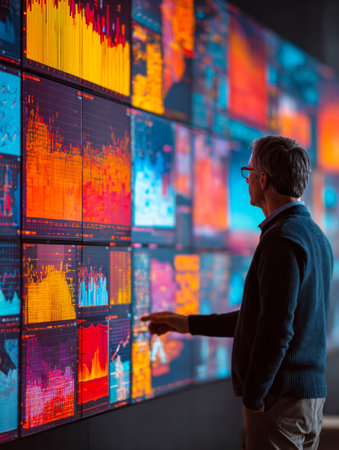
A view from behind of a data analyst or trader looking at a large, illuminated screen filled with a complex business intelligence dashboard. The screen displays various fluctuating graphs, charts, and data visualizations in real-time. This image symbolizes data science, financial analysis, stock trading, and modern technology.
Коллекция по умолчанию
Коллекция по умолчанию
Создать новую
Young businessman looking at computer monitor with charts, analyzing statistics information and data to create project report, doing financial research. Pc screen with network presentation.
Коллекция по умолчанию
Коллекция по умолчанию
Создать новую
Digital signal processing system with waveform analysis, filter settings, and output visualization on computer screen
Коллекция по умолчанию
Коллекция по умолчанию
Создать новую
A computer screen displaying multiple financial reports, graphs and pie in corporate office background. beautiful Generative AI AIG32
Коллекция по умолчанию
Коллекция по умолчанию
Создать новую
Business data dashboard provide business intelligence analytic for marketing strategy planning brisk with big data set to analyze customer demands and foreseeing business future
Коллекция по умолчанию
Коллекция по умолчанию
Создать новую
A computer monitor and keyboard are placed on a desk. Generative AI
Коллекция по умолчанию
Коллекция по умолчанию
Создать новую
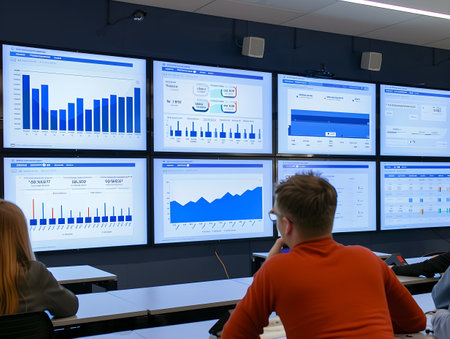
A team of professionals engages in a collaborative meeting, analyzing vibrant data visualizations on a large screen while discussing strategies and insights in a sleek, contemporary office setting.
Коллекция по умолчанию
Коллекция по умолчанию
Создать новую
Revolutionary e-commerce analytics dashboard data streams flowing in mid-air
Коллекция по умолчанию
Коллекция по умолчанию
Создать новую

Blurry background people discuss near mobile TV mount at hotel hallway
Коллекция по умолчанию
Коллекция по умолчанию
Создать новую
A collection of computer monitors showcases dynamic financial data and analytics. The vibrant graphs and dark themes create a modern workspace ideal for professionals.
Коллекция по умолчанию
Коллекция по умолчанию
Создать новую
This image showcases an advanced analytics workshop setting with multiple interactive screens displaying real-time data visualizations and dashboards The environment appears to be a professional
Коллекция по умолчанию
Коллекция по умолчанию
Создать новую
Computer screen with graphs and metrics
Коллекция по умолчанию
Коллекция по умолчанию
Создать новую
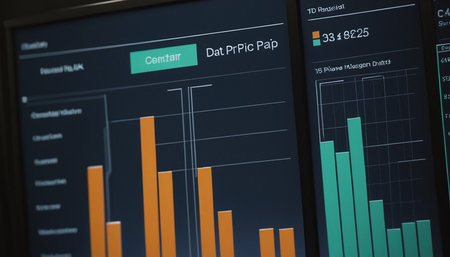
A close-up of a financial bar chart on a computer screen, showing different data categories with colorful bars, set in a modern office environment.
Коллекция по умолчанию
Коллекция по умолчанию
Создать новую
Modern data dashboard showcasing global statistics, interactive charts, and visualizations for business intelligence in a contemporary workspace, enhancing decision-making.
Коллекция по умолчанию
Коллекция по умолчанию
Создать новую
A digital dashboard displaying key business metrics, showcasing sales performance and data analytics.
Коллекция по умолчанию
Коллекция по умолчанию
Создать новую

KPI Business Analytics Data Dashboard. Analyst Using Computer
Коллекция по умолчанию
Коллекция по умолчанию
Создать новую
In an office setting, a sales manager on a digital dashboard, examining key performance indicators while tracking sales progress and making strategic decisions.
Коллекция по умолчанию
Коллекция по умолчанию
Создать новую
A modern office setting featuring a tablet showcasing financial charts and graphs, complemented by lush indoor plants, creating a productive and inspiring workspace atmosphere.
Коллекция по умолчанию
Коллекция по умолчанию
Создать новую

Stock market graph on screen. Ticker on monitor screen. Investing, Finance and Economic concept. Shallow depth of field.
Коллекция по умолчанию
Коллекция по умолчанию
Создать новую
A close-up of a smartphone screen showing a financial app with graphs tracking investment performance and market trends.
Коллекция по умолчанию
Коллекция по умолчанию
Создать новую
Control dashboard showing temperature and curing status of concrete with IoT monitoring
Коллекция по умолчанию
Коллекция по умолчанию
Создать новую
Futuristic interface display with charts and graphs. 3D rendering
Коллекция по умолчанию
Коллекция по умолчанию
Создать новую
Businessman analyzing investment charts with computer in office. Accounting and finance concept.
Коллекция по умолчанию
Коллекция по умолчанию
Создать новую

Cryptocurrency graph as Bitcoin graphs on the device as computer laptop, smartphone at home. Young money investing concepts.
Коллекция по умолчанию
Коллекция по умолчанию
Создать новую
Smart laptop screen display financial statistic graph or stock market chart. Dashboard show real time marketing business strategy graph represented increasing sales or trading money currency. AIG42.
Коллекция по умолчанию
Коллекция по умолчанию
Создать новую

A close-up of a hand pointing at dynamic financial graphs on a digital screen
Коллекция по умолчанию
Коллекция по умолчанию
Создать новую
A close-up of a tablet displaying a marketing automation dashboard, with workflows and email campaigns in progress. . --ar 16:7 --v 6.1 Job ID: 6394e9d2-fafa-4b8e-bdb9-709c6efc044f
Коллекция по умолчанию
Коллекция по умолчанию
Создать новую
A hand holding a tablet displaying a line graph with trend lines and data points, analyzing patterns and forecasting future trends.
Коллекция по умолчанию
Коллекция по умолчанию
Создать новую
Trading screen with stock pattern and lines Generative ai. Created with Generative AI technology
Коллекция по умолчанию
Коллекция по умолчанию
Создать новую
A close-up of a digital tablet showing rising financial trends, offering space for insights into investment opportunities, business performance, or economic growth
Коллекция по умолчанию
Коллекция по умолчанию
Создать новую
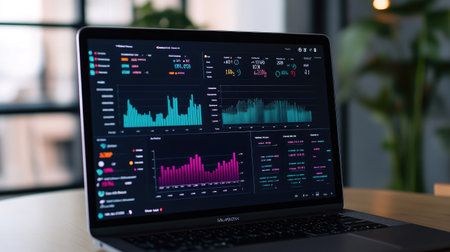
A modern laptop shows a dynamic data analytics dashboard with colorful graphs and statistics displayed on a wooden table outdoors.
Коллекция по умолчанию
Коллекция по умолчанию
Создать новую
Workplace with a laptop and a cup of coffee on the table
Коллекция по умолчанию
Коллекция по умолчанию
Создать новую
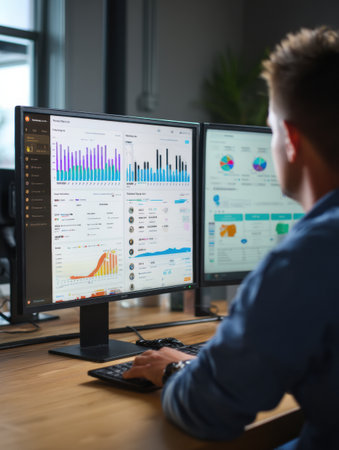
Professional woman analyzing data trends on a computer screen in a modern office workspace
Коллекция по умолчанию
Коллекция по умолчанию
Создать новую
Business Data Analyst Using Computer. African American Advisor
Коллекция по умолчанию
Коллекция по умолчанию
Создать новую
Businessman analyzes various orders displayed on a dashboard UI while seated at a wooden desk in a contemporary office setting during the day.
Коллекция по умолчанию
Коллекция по умолчанию
Создать новую
Business expert reviewing automated sentiment analysis results on a digital dashboard highlighting customer feedback insights.
Коллекция по умолчанию
Коллекция по умолчанию
Создать новую

image of the financial graph on a computer monitor.
Коллекция по умолчанию
Коллекция по умолчанию
Создать новую
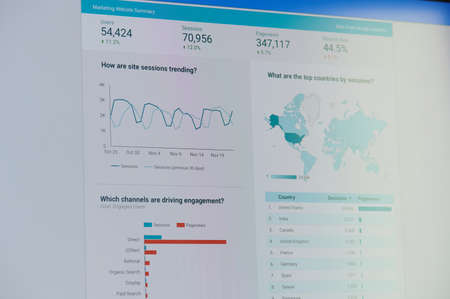
New york, USA - November 24, 2020: Google ads marketing website summarydashboard on laptop screen
Коллекция по умолчанию
Коллекция по умолчанию
Создать новую
Computer screen displaying CRM data and customer report analysis
Коллекция по умолчанию
Коллекция по умолчанию
Создать новую
Close-up of a monitor with a stock market data on it.
Коллекция по умолчанию
Коллекция по умолчанию
Создать новую
A buildings facade features a wall of computer monitors with graphs on them, displaying electric blue multimedia data through transparent glass windows
Коллекция по умолчанию
Коллекция по умолчанию
Создать новую
A Line Graph Illustrates the Rewards of Long-Term Investment
Коллекция по умолчанию
Коллекция по умолчанию
Создать новую
KPI Dashboard Data Analytics On Business Laptop
Коллекция по умолчанию
Коллекция по умолчанию
Создать новую
A digital dashboard displaying key business metrics, showcasing sales performance and data analytics.
Коллекция по умолчанию
Коллекция по умолчанию
Создать новую
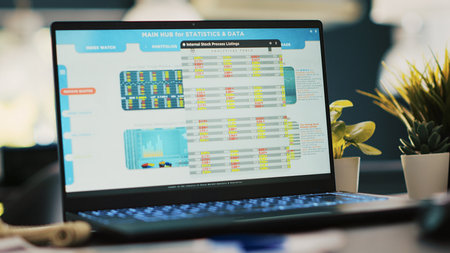
Stock exchange diagrams with charts and stock figures on laptop monitor, close up shot. Hedge fund portfolio listings displayed on notebook screen in financial department
Коллекция по умолчанию
Коллекция по умолчанию
Создать новую
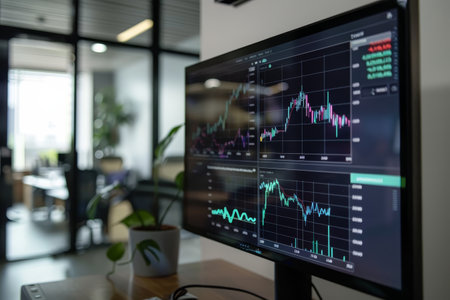
A computer monitor displaying a detailed stock chart graph with various data points and trends, A digital screen displaying graphs and charts of data trends in an office setting
Коллекция по умолчанию
Коллекция по умолчанию
Создать новую

Bishkek, Kyrgyzstan - March 14, 2020: Discord voice communication app for remote work or study.
Коллекция по умолчанию
Коллекция по умолчанию
Создать новую
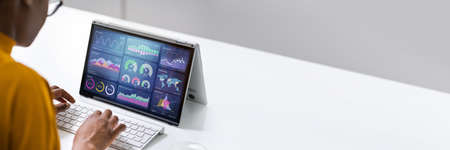
African Businesswoman Using Analytics Data KPI Dashboard Tech
Коллекция по умолчанию
Коллекция по умолчанию
Создать новую
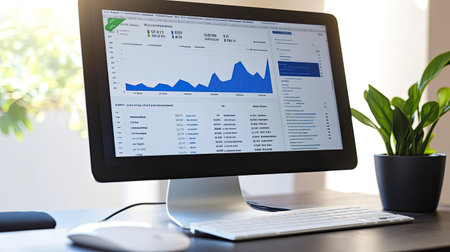
Computer screen filled with business analytics, placed on a table with a mouse and keyboard, and a chair in the background.
Коллекция по умолчанию
Коллекция по умолчанию
Создать новую

Analyst's Laptop: KPI Report on Computer Dashboard Graph
Коллекция по умолчанию
Коллекция по умолчанию
Создать новую
Detailed view of a graph displayed on a digital screen, showing trend analysis for website traffic flow, Incorporate trend analysis for website traffic fluctuations
Коллекция по умолчанию
Коллекция по умолчанию
Создать новую
Futuristic screen with charts and graphs. 3d rendering.
Коллекция по умолчанию
Коллекция по умолчанию
Создать новую
Data Analyst Using Data Analytics KPI Dashboard
Коллекция по умолчанию
Коллекция по умолчанию
Создать новую
Close-up of a financial graph on a computer screen, showcasing upward and downward trends with detailed line and bar charts.
Коллекция по умолчанию
Коллекция по умолчанию
Создать новую
African Advisor Using KPI Dashboard With Financial Analytics Graphs
Коллекция по умолчанию
Коллекция по умолчанию
Создать новую
Futuristic touch user interface. 3d rendering toned image
Коллекция по умолчанию
Коллекция по умолчанию
Создать новую
Legion-Media
Создайте свои проекты на основе качественных стоковых фотографий и видео.


Copyright © Legion-Media.