
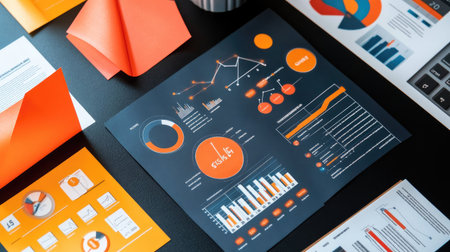
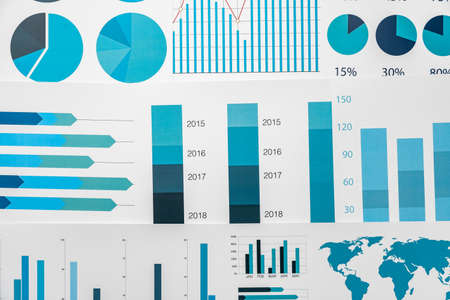
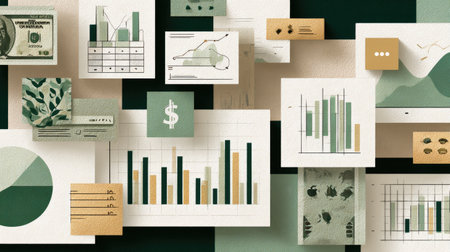
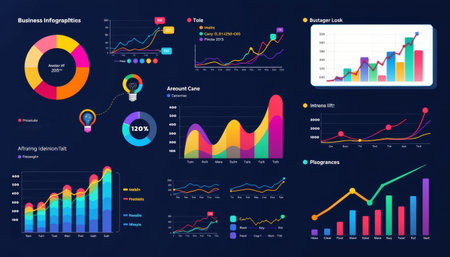
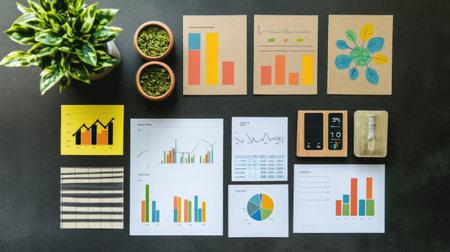
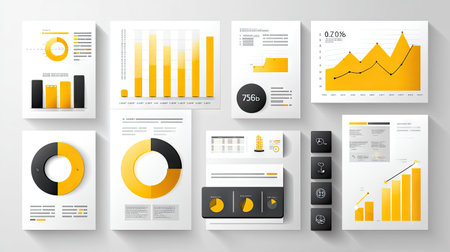
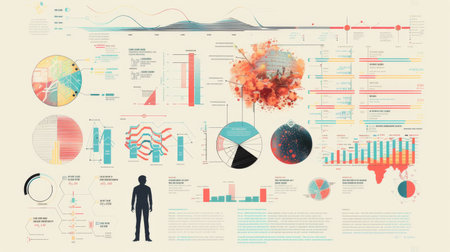
A vibrant collection of data visualization elements including colorful charts and graphs arranged on a dark surface, ideal for business analysis and presentation needs.
Коллекция по умолчанию
Коллекция по умолчанию
Создать новую
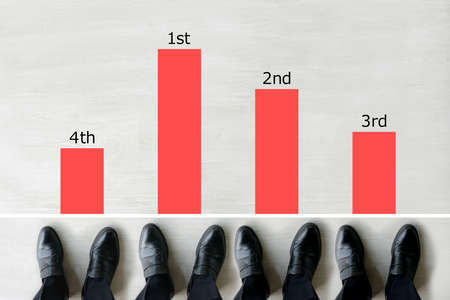
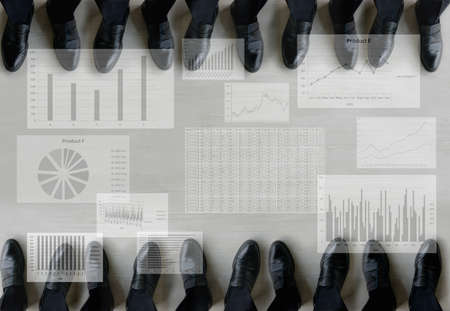
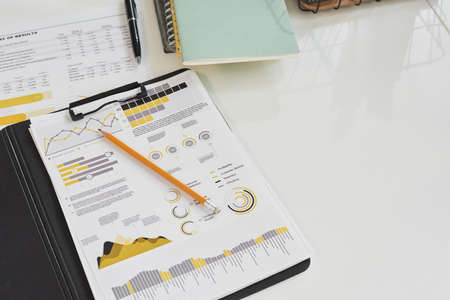
Image of businessman's business performance and annual income graph and ranking
Коллекция по умолчанию
Коллекция по умолчанию
Создать новую
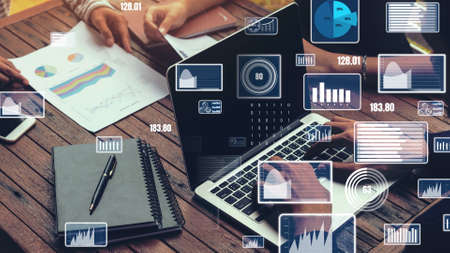
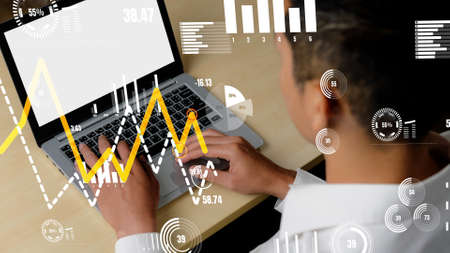
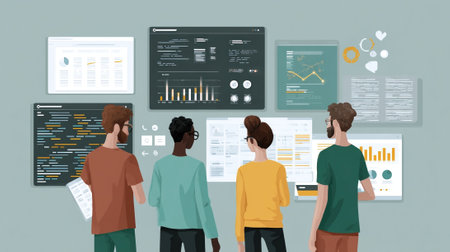
Creative visual of business data analyzing technology . Concept of digital data for marketing analysis and investment decision making .
Коллекция по умолчанию
Коллекция по умолчанию
Создать новую
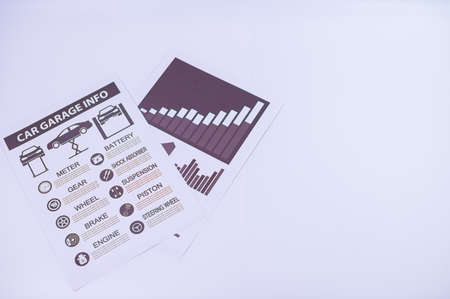
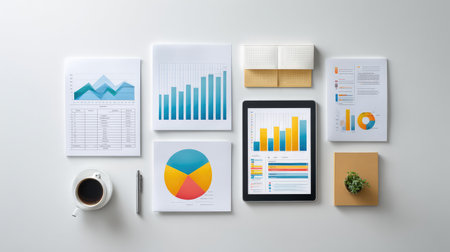
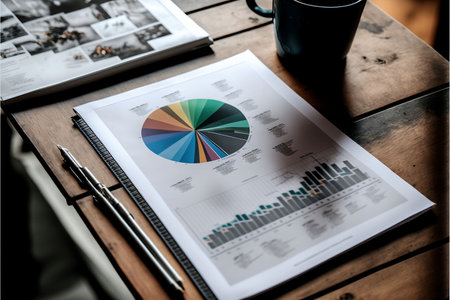
Business document paper placed on a white scene
Коллекция по умолчанию
Коллекция по умолчанию
Создать новую

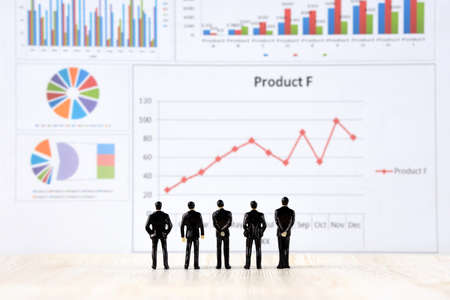
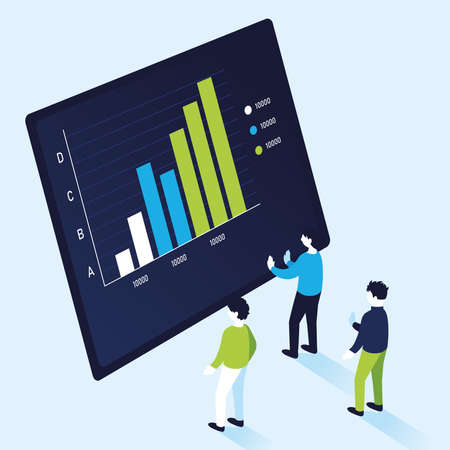
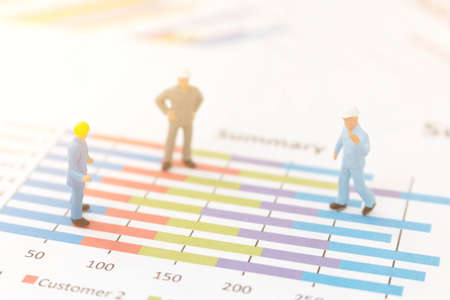
Businessmen miniature figure standing on investment and profit graph for analysis and discussion.
Коллекция по умолчанию
Коллекция по умолчанию
Создать новую
Businessman hand holding a document. Scenes white background.
Коллекция по умолчанию
Коллекция по умолчанию
Создать новую
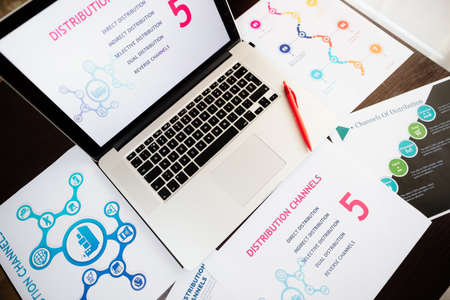
marketing distribution channels plan on office desk
Коллекция по умолчанию
Коллекция по умолчанию
Создать новую

Team work with results and reports
Коллекция по умолчанию
Коллекция по умолчанию
Создать новую

Modern vector line 3D illustration. Infographic circles template with six elements, squares, icons. Designed for business, presentations, web design, interface, workflow layout, diagrams with 6 steps.
Коллекция по умолчанию
Коллекция по умолчанию
Создать новую

A dynamic workspace showcasing business charts, graphs, and marketing icons on a wooden desk, perfect for illustrating planning and strategy development.
Коллекция по умолчанию
Коллекция по умолчанию
Создать новую
Business Concept - Analysis
Коллекция по умолчанию
Коллекция по умолчанию
Создать новую
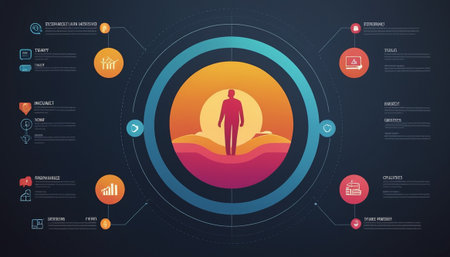
Infographic template with human silhouette and icons on blue background. Vector illustration
Коллекция по умолчанию
Коллекция по умолчанию
Создать новую
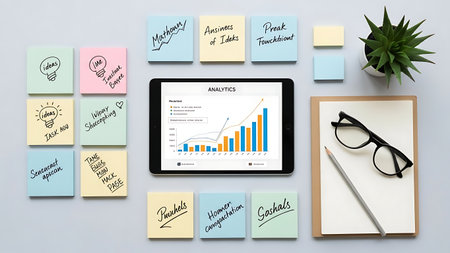
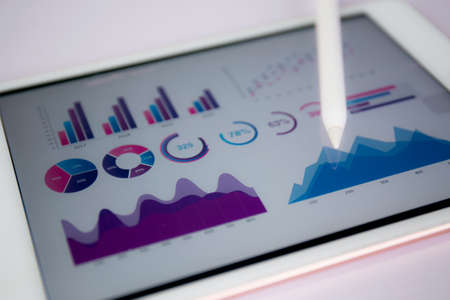
Business graph and chart on digital tablet screen with pencil and glasses.
Коллекция по умолчанию
Коллекция по умолчанию
Создать новую

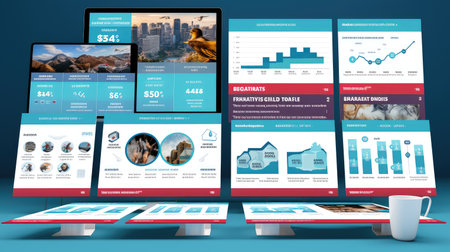
Modern office workplace with laptop computer mockup, tablet pc and smartphone on the office desk. There is a laptop, tablet computer, smartphone on the table. For design presentation or portfolio.
Коллекция по умолчанию
Коллекция по умолчанию
Создать новую
Vector illustration of a modern business website template with editable infographic elements
Коллекция по умолчанию
Коллекция по умолчанию
Создать новую

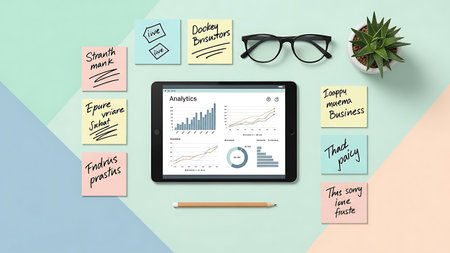
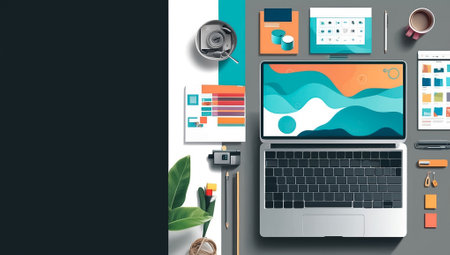
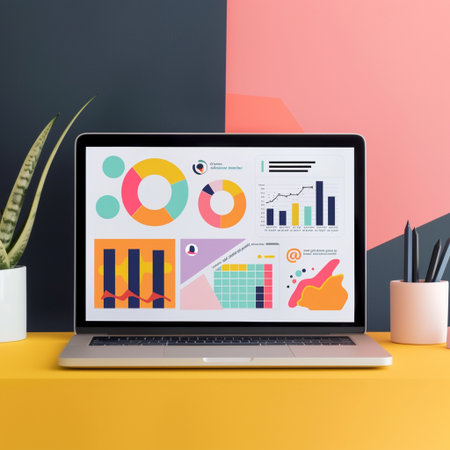
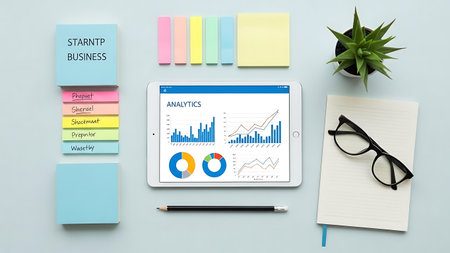
A colorful workspace featuring a laptop displaying vibrant data visualization. The scene includes charts, notebooks, coffee, and stationery, inspiring creativity and productivity.
Коллекция по умолчанию
Коллекция по умолчанию
Создать новую
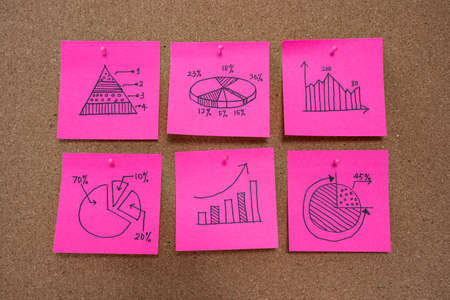
Different business graph charts on pink sticky notes for business planning and analysis
Коллекция по умолчанию
Коллекция по умолчанию
Создать новую
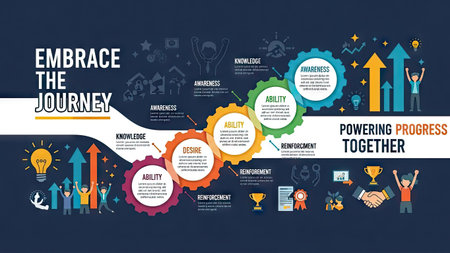
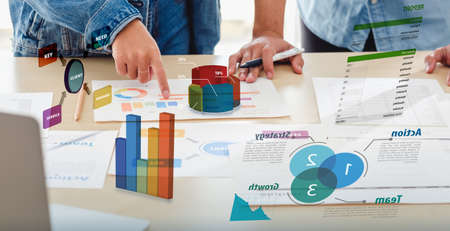
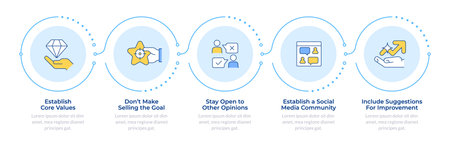
An infographic showcases business-related concepts, utilizing vibrant colors and stylized graphic elements. The composition includes textual components suggesting various stages of a process, along with decorative icons. It indicates teamwork and growth in a digitally illustrated design. Suitable for editorial and commercial use.
Коллекция по умолчанию
Коллекция по умолчанию
Создать новую
modern laptop for business, flat design illustration
Коллекция по умолчанию
Коллекция по умолчанию
Создать новую
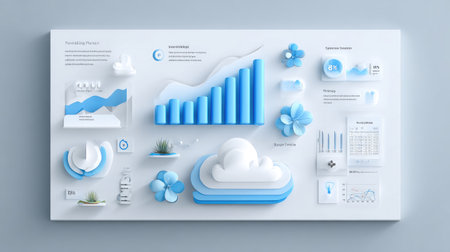
A modern, minimalist data visualization concept featuring blue elements such as graphs, clouds, and floral designs perfect for creative projects and business presentations.
Коллекция по умолчанию
Коллекция по умолчанию
Создать новую
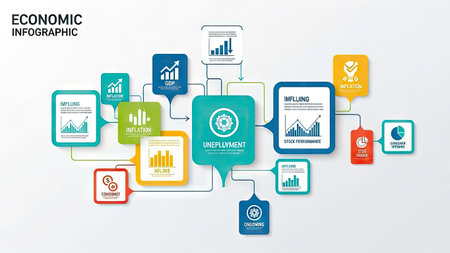
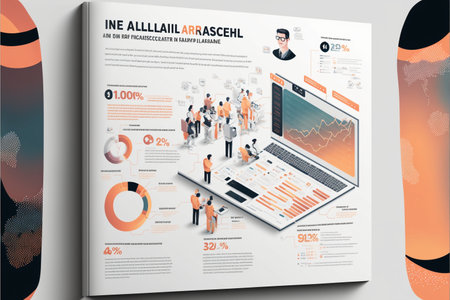
This infographic presents economic data visualization with charts and graphs on a white backdrop. It employs a vibrant color palette and a modern design. The composition suggests an informational graphic intended for business, finance, or educational purposes. Its versatile layout supports various commercial or editorial applications.
Коллекция по умолчанию
Коллекция по умолчанию
Создать новую
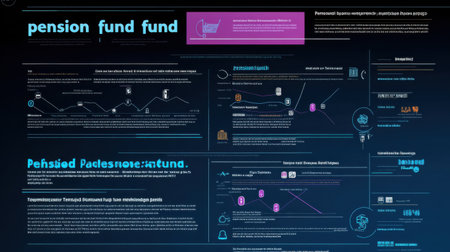
This informative chart details various retirement fund options, highlighting their features, benefits, and strategies for effective financial planning and investment choices.
Коллекция по умолчанию
Коллекция по умолчанию
Создать новую
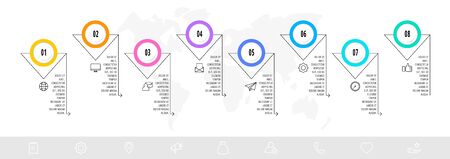
Infographic design vector and marketing icons can be used for workflow layout, diagram, annual report, web design. Business concept with 8 options, steps or processes.
Коллекция по умолчанию
Коллекция по умолчанию
Создать новую
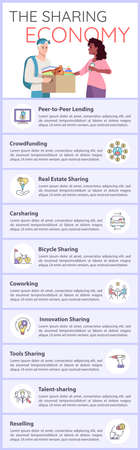
Sharing economy vector infographic template. Collaborative consumption UI web banner with flat characters. Peer to peer lending services Cartoon advertising flyer, leaflet, ppt info poster idea
Коллекция по умолчанию
Коллекция по умолчанию
Создать новую
Financial paper with charts and diagrams on gray table
Коллекция по умолчанию
Коллекция по умолчанию
Создать новую
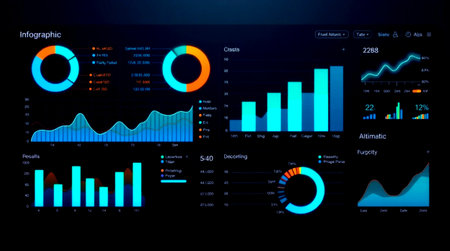
Conceptual business dashboard for financial data analysis . 3D render computer graphic .
Коллекция по умолчанию
Коллекция по умолчанию
Создать новую

A modern workspace showcasing a laptop and notebook alongside a hand-drawn network diagram. Perfect for illustrating creativity, planning, and collaboration in business.
Коллекция по умолчанию
Коллекция по умолчанию
Создать новую
Hands typing on a laptop with credit card application in the screen
Коллекция по умолчанию
Коллекция по умолчанию
Создать новую
This abstract image showcases financial data through varied charts and graphs, combined with icons and textures, perfect for business presentations and marketing materials.
Коллекция по умолчанию
Коллекция по умолчанию
Создать новую
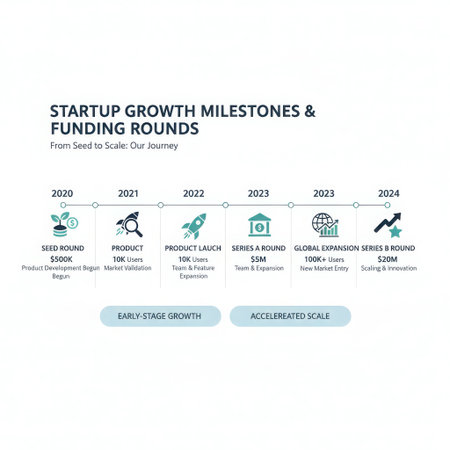
A clean and professional timeline infographic illustrating a startup's journey through key growth milestones and funding rounds from 2020 to 2024. The timeline highlights two main phases: early-stage growth from 2020-2022 and accelerated scale from 2023-2024. Milestones include the initial Seed Round for $500K in 2020, product launch and user acquisition in 2021-2022, Series A funding of $5M in 2023, global expansion, and Series B funding of $20M in 2024. It visually represents the progression of a startup from initial development to scaling and significant investment rounds.
Коллекция по умолчанию
Коллекция по умолчанию
Создать новую
business documents over papers with numbers and charts. View from above
Коллекция по умолчанию
Коллекция по умолчанию
Создать новую
Laptop screen on yellow office desktop with stationery and copy space
Коллекция по умолчанию
Коллекция по умолчанию
Создать новую
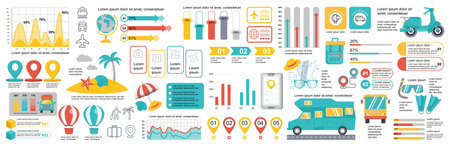
Mega set of travel infographic elements data visualization vector design template. Can be used for steps, options, business process, workflow, diagram, flowchart, timeline. Bundle info graphics.
Коллекция по умолчанию
Коллекция по умолчанию
Создать новую

An overhead shot of a desk cluttered with financial reports and a laptop displaying a detailed business graph, capturing the essence of analysis and productivity in the workplace.
Коллекция по умолчанию
Коллекция по умолчанию
Создать новую

closeup Office business workplace with laptop on desk computer background document on table copy space workspace creative design books, modern interior
Коллекция по умолчанию
Коллекция по умолчанию
Создать новую
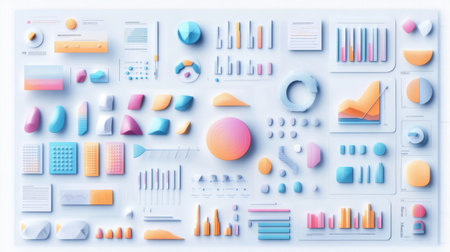
This image features a vibrant assortment of 3D shapes and colorful data visualization elements, ideal for enhancing reports and presentations.
Коллекция по умолчанию
Коллекция по умолчанию
Создать новую
Monthly percentage bar chart showing financial comparison of 2026 budget versus actual performance data displayed on digital screen. Results tracking.
Коллекция по умолчанию
Коллекция по умолчанию
Создать новую

Infographic brochure template. A4 pages with charts, diagrams and workflow elements. Business data visualization concept. Vector illustration for presentation, statistical report, website
Коллекция по умолчанию
Коллекция по умолчанию
Создать новую
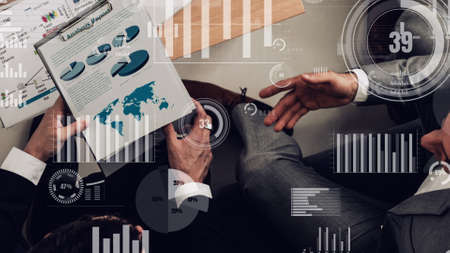
Conceptual vision of business people in corporate staff meeting . Concept of digital technology for marketing data analysis and investment decision making .
Коллекция по умолчанию
Коллекция по умолчанию
Создать новую
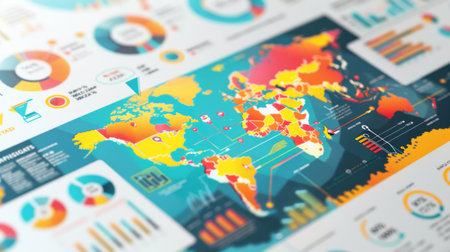
A detailed infographic chart displaying global economic trends with colorful graphs and statistics.
Коллекция по умолчанию
Коллекция по умолчанию
Создать новую
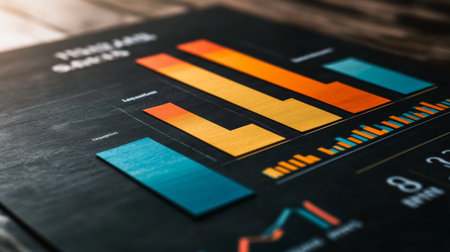
A vibrant bar chart displayed on a dark surface, showcasing data analysis and statistical trends, ideal for business presentations and reports.
Коллекция по умолчанию
Коллекция по умолчанию
Создать новую

Financial report data of business operations (balance sheet and income statement and diagram) as Fintech concept.co working website designers working at office and holding a cup of coffee,working on smart phone and digital tablet.
Коллекция по умолчанию
Коллекция по умолчанию
Создать новую
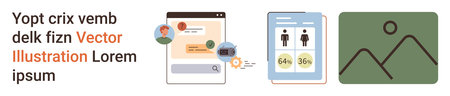
Online communication, data visualization, info sharing, digital documentation, user interface design, graphic media. A chat interface, statistical data and an image frame. Online communication
Коллекция по умолчанию
Коллекция по умолчанию
Создать новую
Tablet pc with financial charts and graphs on the screen. Business concept
Коллекция по умолчанию
Коллекция по умолчанию
Создать новую
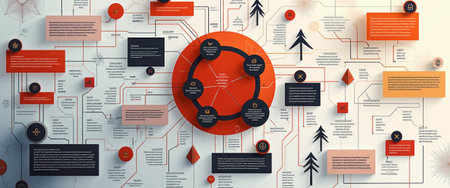
This visually striking infographic features a central circular diagram surrounded by various interconnected elements, all in bold reds, blacks, and oranges. The design effectively communicates complex ideas, making it an ideal resource for presentations, educational materials, or digital content.
Коллекция по умолчанию
Коллекция по умолчанию
Создать новую

Business plan documents and charts for eco-tourism startup on rustic wooden table
Коллекция по умолчанию
Коллекция по умолчанию
Создать новую
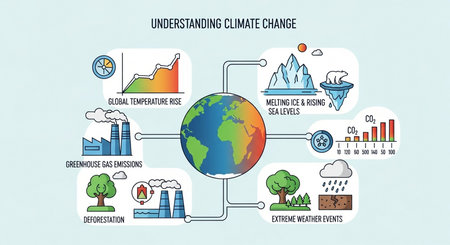
Climate change infographic. Infographics of climate change. Vector illustration in flat style
Коллекция по умолчанию
Коллекция по умолчанию
Создать новую
Business infographic finance chart graph data analytics dashboard statistics Business infographic finance chart graph data analytics dashboard
Коллекция по умолчанию
Коллекция по умолчанию
Создать новую

Conceptual vision of business people in the corporate staff meeting . Concept of digital technology for marketing data analysis and investment decision making .
Коллекция по умолчанию
Коллекция по умолчанию
Создать новую

top view of tablet pc with financial charts on screen and office supplies on table
Коллекция по умолчанию
Коллекция по умолчанию
Создать новую

Close up of business workplace with financial reports and marketing items. Accounting
Коллекция по умолчанию
Коллекция по умолчанию
Создать новую
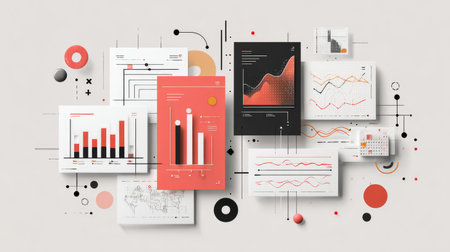
Modern abstract composition showcasing various charts and graphs in red, black, and white colors, ideal for presentations and data analysis projects.
Коллекция по умолчанию
Коллекция по умолчанию
Создать новую
Business Image - Analysis
Коллекция по умолчанию
Коллекция по умолчанию
Создать новую
Business diagram with 8 circular elements with arrows. Vector flat concept of eight business options to choose from. Infographics modern design for flowchart, timeline, web, graph, presentation
Коллекция по умолчанию
Коллекция по умолчанию
Создать новую

BEKASI, WEST JAVA, INDONESIA. APRIL 1, 2020 : Canva: Graphic Design dev application on Smartphone screen. Flyers, Logos, Posters is a freeware web browser developed by Canva
Коллекция по умолчанию
Коллекция по умолчанию
Создать новую
close up hand creative designer team casual meeting and brainstroming on desk with paperwrok and online data on laptop in meeting room at modern office.business planning concept
Коллекция по умолчанию
Коллекция по умолчанию
Создать новую
A visually engaging workspace featuring colorful charts and graphs alongside planters, ideal for presentations, data analysis, and professional brainstorming sessions.
Коллекция по умолчанию
Коллекция по умолчанию
Создать новую
Explore a collection of modern business analytics showcasing various charts and graphs in striking yellow and black, perfect for presentations and professional insights.
Коллекция по умолчанию
Коллекция по умолчанию
Создать новую
Close-up of financial business strategy on the table at office
Коллекция по умолчанию
Коллекция по умолчанию
Создать новую
An illustration of a diverse team of data scientists collaborating over screens filled with code and graphs embodying the human effort behind developing sophisticated frauddetectio
Коллекция по умолчанию
Коллекция по умолчанию
Создать новую
A clean and organized workspace featuring charts, graphs, and digital tools for effective business data analysis, highlighting productivity and professional presentation.
Коллекция по умолчанию
Коллекция по умолчанию
Создать новую

Many type of infographic diagram over white background. Top view.
Коллекция по умолчанию
Коллекция по умолчанию
Создать новую

A vibrant workspace featuring analytics charts, graphs, and various office supplies on a wooden table, perfect for illustrating business analysis and strategic planning themes.
Коллекция по умолчанию
Коллекция по умолчанию
Создать новую
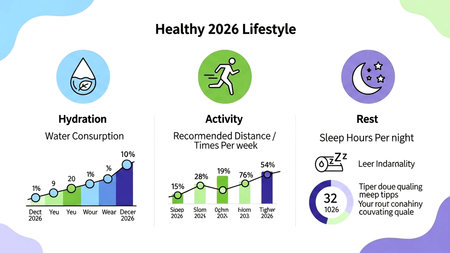
Comprehensive infographic visualizing healthy 2026 lifestyle metrics: hydration, physical activity, and sleep patterns. Perfect for health reports, wellness programs, and data-driven presentations.
Коллекция по умолчанию
Коллекция по умолчанию
Создать новую
Celebration background with serpentine and confetti. Vector illustration.
Коллекция по умолчанию
Коллекция по умолчанию
Создать новую
bars chart infographic with men design, Data information and analytics theme Vector illustration
Коллекция по умолчанию
Коллекция по умолчанию
Создать новую
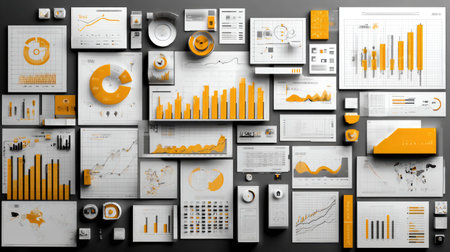
Discover a vibrant collection of data visualization elements featuring graphs, charts, and diagrams in orange and white, perfect for business analytics and professional reports.
Коллекция по умолчанию
Коллекция по умолчанию
Создать новую
Business workplace with office stuff and tablet pc showing financial graph on screen
Коллекция по умолчанию
Коллекция по умолчанию
Создать новую

Close-up of male hand holdig blue clipboard with chart as profit data analysis concept with copy space
Коллекция по умолчанию
Коллекция по умолчанию
Создать новую

A vibrant digital composition illustrates an advanced online learning platform featuring graphs, charts, and interactive elements in a colorful design. Students engage with modern educational tools.
Коллекция по умолчанию
Коллекция по умолчанию
Создать новую

A detailed business report featuring graphs and statistics placed on a dark office desk surrounded by greenery and stationery items, creating a modern workspace aesthetic.
Коллекция по умолчанию
Коллекция по умолчанию
Создать новую

interest rates text and graph showing cost of financing going up next real estate value going down, concept of the global economy after the covid-19 pandemic
Коллекция по умолчанию
Коллекция по умолчанию
Создать новую

Collaborative team analyzes data with colorful infographics in a bright office setting
Коллекция по умолчанию
Коллекция по умолчанию
Создать новую
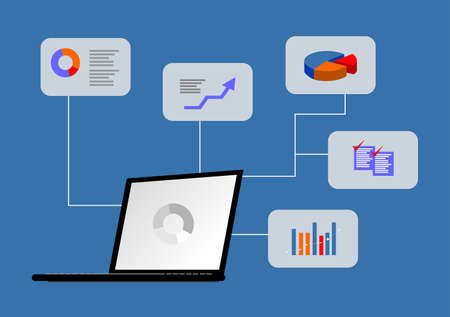
a picture of a laptop and some graphic icons in a bubble around it
Коллекция по умолчанию
Коллекция по умолчанию
Создать новую
An AI generated illustration of project management graphs charts paper
Коллекция по умолчанию
Коллекция по умолчанию
Создать новую

Tablet pc showing charts on screen and a cup of cappuccino
Коллекция по умолчанию
Коллекция по умолчанию
Создать новую

Reviewing group in casual-professional clothes at office, tapping tablets and viewing pie charts. Devices, collaboration, teamwork, data, analytics, dashboards, overlays
Коллекция по умолчанию
Коллекция по умолчанию
Создать новую
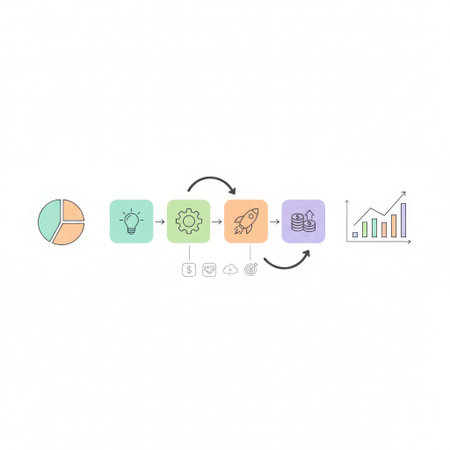
A minimalist infographic illustrating a business or startup lifecycle process. The flow begins with a pie chart representing initial data analysis or planning. It progresses through four key stages represented by icons: a lightbulb for idea generation, a gear for development and process implementation, a rocket for product launch or startup acceleration, and stacked coins for investment and financial growth. The diagram includes a circular feedback loop between the process and growth stages, suggesting iterative improvement. The sequence concludes with an ascending bar chart, symbolizing successful business growth and increasing revenue.
Коллекция по умолчанию
Коллекция по умолчанию
Создать новую
marketing table infographics illustration campaign results, website traffic, media engagement marketing table infographics
Коллекция по умолчанию
Коллекция по умолчанию
Создать новую
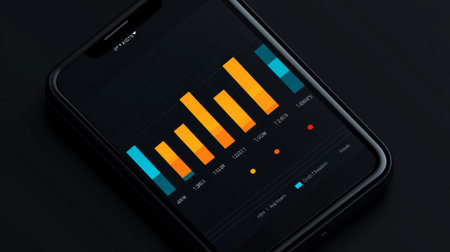
A modern smartphone showcases vibrant bar graphs and data visualizations against a dark background, perfect for illustrating business analytics and technological themes.
Коллекция по умолчанию
Коллекция по умолчанию
Создать новую

Business infographic elements set. Data visualization bundle for creative marketing presentation and workflow layout. Colorful stock and flow charts, line, circle and bar graphs vector illustration.
Коллекция по умолчанию
Коллекция по умолчанию
Создать новую
Report graph and chart of investment with finance on tablet computer on desk, datum of stock and growth, planning and statistic with economic, no people, digital marketing, business concept.
Коллекция по умолчанию
Коллекция по умолчанию
Создать новую
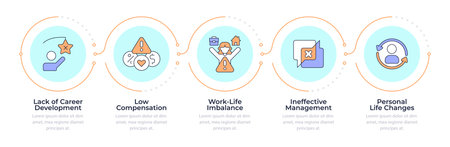
Causes of voluntary employee turnover infographic 5 steps. Job quieting process. Human resources. Flow chart infochart. Editable vector info graphics icons. Montserrat-SemiBold, Regular fonts used
Коллекция по умолчанию
Коллекция по умолчанию
Создать новую
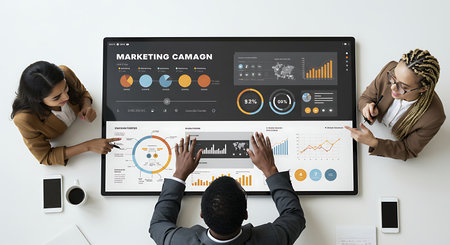
From a top-down perspective, a diverse team of three professionals collaborates in a modern office, interacting with a large touchscreen displaying marketing campaign analytics.
Коллекция по умолчанию
Коллекция по умолчанию
Создать новую
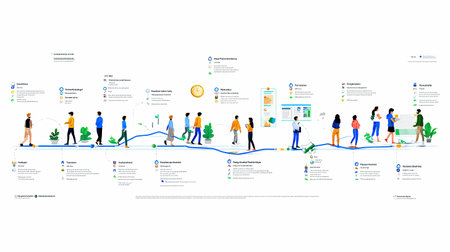
Vibrant infographic illustrating the user journey through a digital product. Features various stages, interactions, and personas to enhance understanding of experiences.
Коллекция по умолчанию
Коллекция по умолчанию
Создать новую

Digital tablet displaying bar charts surrounded by colorful 3D pie charts and blocks. Represents data analysis, business insights, and analytics
Коллекция по умолчанию
Коллекция по умолчанию
Создать новую
Top view of business workplace with digital tablet, smartphone, notebook and stationery
Коллекция по умолчанию
Коллекция по умолчанию
Создать новую
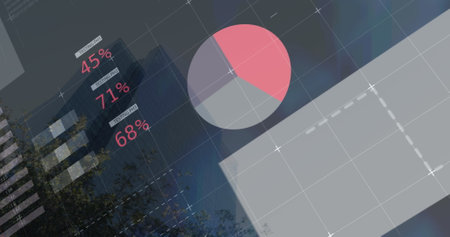
Image of infographic interface against low angle view of building in background. Digital composite, multiple exposure, global, report, finance, database, business, skyscrapers and technology.
Коллекция по умолчанию
Коллекция по умолчанию
Создать новую
An infographic poster presenting statistical data in visually appealing graphs and illustrations for easy understanding.
Коллекция по умолчанию
Коллекция по умолчанию
Создать новую

3D rendering of a medical brochure with a lot of icons
Коллекция по умолчанию
Коллекция по умолчанию
Создать новую

Minimal infographics with 8 line circles elements. Vector modern visualization of eight step by step timeline concept with arrows. Template for diagram, business, web, presentations, flowchart, chart
Коллекция по умолчанию
Коллекция по умолчанию
Создать новую

Multimedia and Computer Applications conceptual . Business people using technology of digital gadget with modern graphic interface showing social, shopping, and multimedia application on device.
Коллекция по умолчанию
Коллекция по умолчанию
Создать новую

Graph of market share with black pen in business concept
Коллекция по умолчанию
Коллекция по умолчанию
Создать новую

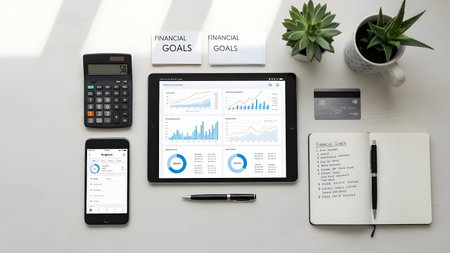
Modern workspace with financial data displayed on devices.
Коллекция по умолчанию
Коллекция по умолчанию
Создать новую
Businessman standing on a graph chart
Коллекция по умолчанию
Коллекция по умолчанию
Создать новую

Collage of growth metrics and office themes showcasing a blend of playful and professional design
Коллекция по умолчанию
Коллекция по умолчанию
Создать новую

Flat lay of product development timeline and startup vision pages
Коллекция по умолчанию
Коллекция по умолчанию
Создать новую

A light bulb symbolizes creativity surrounded by various charts, graphs, and notes representing ideas and data analysis. The mint green background enhances the visual appeal.
Коллекция по умолчанию
Коллекция по умолчанию
Создать новую

Business visual data analyzing technology by creative computer software
Коллекция по умолчанию
Коллекция по умолчанию
Создать новую
Marketing campaign methodology infographic 5 steps. Social media, communication. Product advertising. Flow chart infochart. Editable vector info graphics icons. Montserrat-SemiBold, Regular fonts used
Коллекция по умолчанию
Коллекция по умолчанию
Создать новую
Legion-Media
Создайте свои проекты на основе качественных стоковых фотографий и видео.


Copyright © Legion-Media.