

The datacenter is equipped with advanced server hardware DELL EMC - Moscow, Russia, September 10, 2022
Коллекция по умолчанию
Коллекция по умолчанию
Создать новую

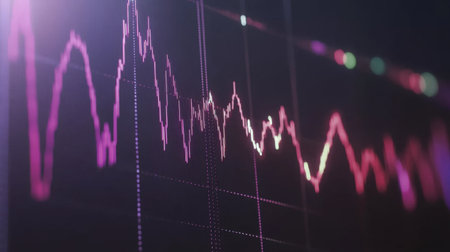
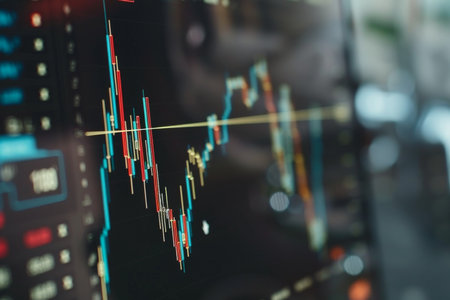
Shallow depth of field (selective focus) with details of a chart showing the stock market crash from March 2020 due to the Covid-19 pandemic on a computer screen (S&P500 index)
Коллекция по умолчанию
Коллекция по умолчанию
Создать новую

Science neon quoting einstein equation
Коллекция по умолчанию
Коллекция по умолчанию
Создать новую
A vibrant image of a large monitor displaying a detailed gold price chart with various technical indicators and a prominent upward trend in gold prices.
Коллекция по умолчанию
Коллекция по умолчанию
Создать новую
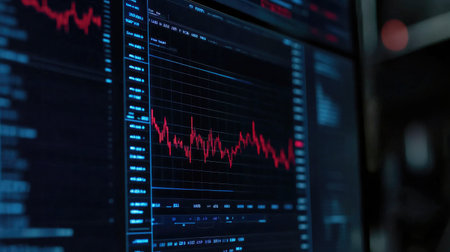
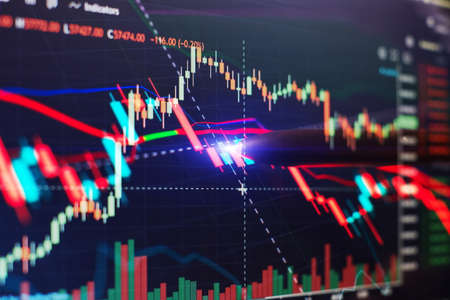
Close-up of stock market data displayed on a digital interface, featuring red trend lines and charts. Ideal for finance and technology themes.
Коллекция по умолчанию
Коллекция по умолчанию
Создать новую

image of the financial graph on a computer monitor.
Коллекция по умолчанию
Коллекция по умолчанию
Создать новую
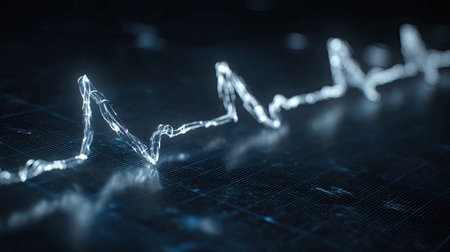
abstract blue background with red electrocardiogram. 3d rendering
Коллекция по умолчанию
Коллекция по умолчанию
Создать новую
Dynamic digital interface illustrating stock market trends with red highlights and data analysis
Коллекция по умолчанию
Коллекция по умолчанию
Создать новую

3D rendering cryptocurrency enjin coin on colorful background, cryptocurrency concept 3D illustration
Коллекция по умолчанию
Коллекция по умолчанию
Создать новую

Financial stock market graph. Stock Exchange. Selective focus.
Коллекция по умолчанию
Коллекция по умолчанию
Создать новую

ICON ICX Cryptocurrency. coin growth chart on the exchange, chart
Коллекция по умолчанию
Коллекция по умолчанию
Создать новую
IOST Cryptocurrency. coin growth chart on the exchange, chart
Коллекция по умолчанию
Коллекция по умолчанию
Создать новую
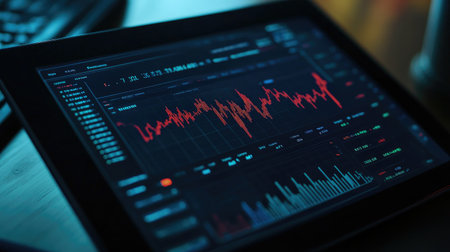
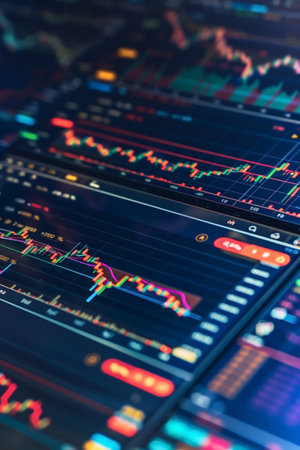
Detailed shot of a stock chart with market trends and performance metrics displayed on a tablet or laptop
Коллекция по умолчанию
Коллекция по умолчанию
Создать новую

E = mc 2 Word Written on Wooden Cubes
Коллекция по умолчанию
Коллекция по умолчанию
Создать новую
View of Stock Market Crash from Covid-19 Pandemic with shallow depth of field.
Коллекция по умолчанию
Коллекция по умолчанию
Создать новую

financial graph on the monitor, business concept of financial data analysis.
Коллекция по умолчанию
Коллекция по умолчанию
Создать новую
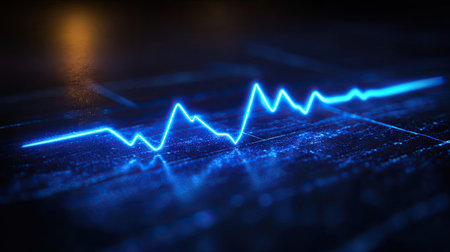
An abstract, glowing blue line undulates across a dark surface in this image. The composition features a shallow depth of field, with soft lighting and a focus on the central element. The color palette primarily uses shades of blue and black. This visual could be utilized in technology, science, or data-related commercial projects.
Коллекция по умолчанию
Коллекция по умолчанию
Создать новую
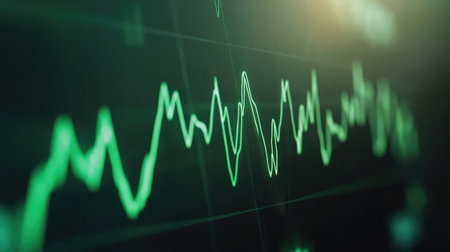
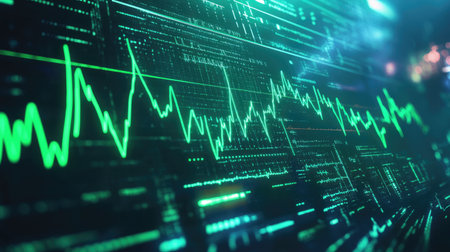
Abstract representation of fluctuating graph lines in green, showcasing data visualization. Perfect for illustrating financial or analytical concepts.
Коллекция по умолчанию
Коллекция по умолчанию
Создать новую
A financial chart illustrates a notable surge in stock market profits, fueled by rising interest rates and consistent growth in money investments during recent months.
Коллекция по умолчанию
Коллекция по умолчанию
Создать новую
Red seismic waves pulsating on a dark monitoring screen indicate ongoing earthquake activity, providing crucial real time data for geologists and researchers
Коллекция по умолчанию
Коллекция по умолчанию
Создать новую

Trader investor broker holding finger using cell phone app executing financial stock trade market trading order to buy or sell
Коллекция по умолчанию
Коллекция по умолчанию
Создать новую
This striking abstract image shows white financial graphs plotted on a blue grid. It represents market analysis, economic trends, and data visualization for finance concepts.
Коллекция по умолчанию
Коллекция по умолчанию
Создать новую
A neon-style red ECG waveform with a bright glowing effect on a digital screen.
Коллекция по умолчанию
Коллекция по умолчанию
Создать новую
Close up of digital screen displaying line graph of cancer research trends and medical insights
Коллекция по умолчанию
Коллекция по умолчанию
Создать новую
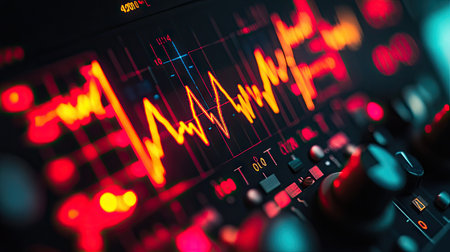
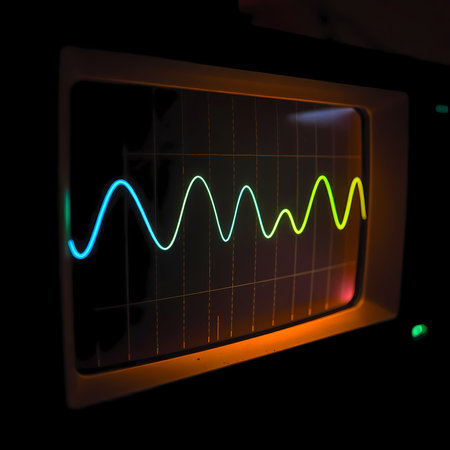
Close-up of an oscilloscope displaying a detailed electrical waveform, with a focus on the signal's amplitude and frequency -
Коллекция по умолчанию
Коллекция по умолчанию
Создать новую

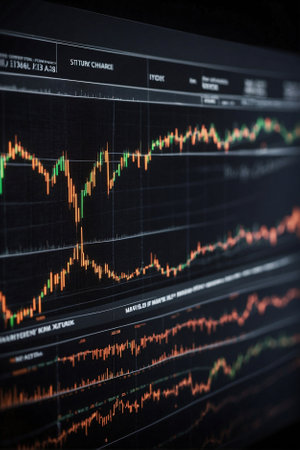
Business and Economy Theme. Trading Cryptocurrencies. Stock Market Candles Chart on Computer Display Close Up.
Коллекция по умолчанию
Коллекция по умолчанию
Создать новую

Business chart with line graph, bar chart and numbers on dark background, 3d rendering. Computer digital drawing.
Коллекция по умолчанию
Коллекция по умолчанию
Создать новую
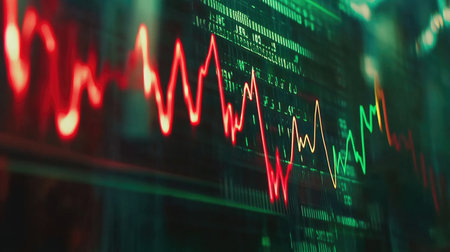
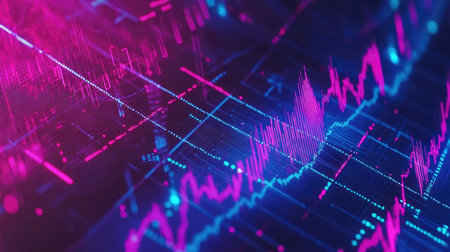
Abstract representation of stock market trends with vibrant lines. This image captures data fluctuations in finance, highlighting investment opportunities and market analysis.
Коллекция по умолчанию
Коллекция по умолчанию
Создать новую
Financial stock market data visualization with charts
Коллекция по умолчанию
Коллекция по умолчанию
Создать новую

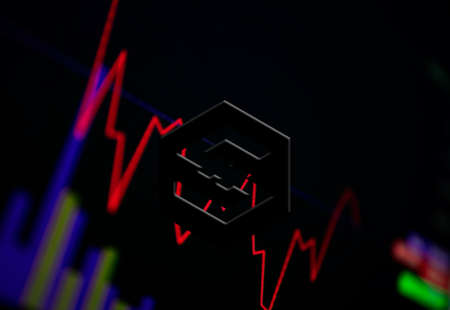
Radiated emissions spectrogram with limit lines in EMC electromagnetic compatibility test report
Коллекция по умолчанию
Коллекция по умолчанию
Создать новую

Real-time analysis of the cryptocurrency market in a smartphone. panorama, macro
Коллекция по умолчанию
Коллекция по умолчанию
Создать новую
Computer screen displaying colorful graphs and various electronic equipment
Коллекция по умолчанию
Коллекция по умолчанию
Создать новую

financial graph on monitor for business and finance concept. shallow depth of field
Коллекция по умолчанию
Коллекция по умолчанию
Создать новую
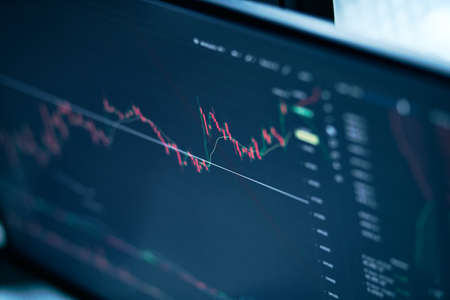
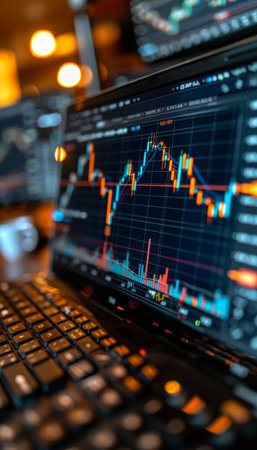
A close-up shot of a stock market chart displayed on a laptop screen, showing financial data and market trends.
Коллекция по умолчанию
Коллекция по умолчанию
Создать новую
A close-up of a gold price chart with candlestick patterns and indicators, featuring golden bars and trend lines against a professional, dark background.
Коллекция по умолчанию
Коллекция по умолчанию
Создать новую
Close-up of a digital oscilloscope screen displaying vibrant electrical waveforms and signal patterns
Коллекция по умолчанию
Коллекция по умолчанию
Создать новую
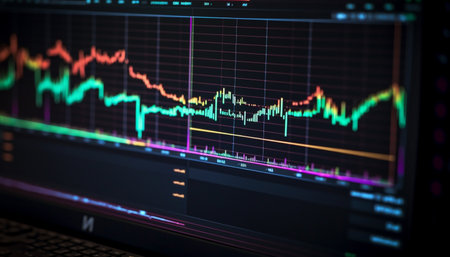
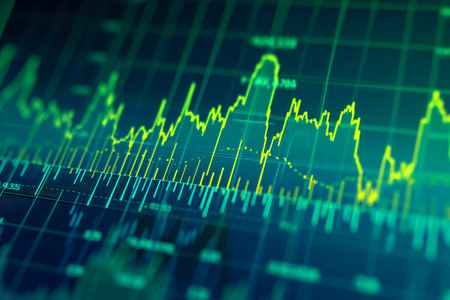
Glowing green digital financial chart displaying stock market trends and data analysis
Коллекция по умолчанию
Коллекция по умолчанию
Создать новую
Close-up of a waveform on an audio analyzer screen, showing detailed peaks and troughs of electrical signals
Коллекция по умолчанию
Коллекция по умолчанию
Создать новую
Stock market graphs on the lcd monitor.
Коллекция по умолчанию
Коллекция по умолчанию
Создать новую
A 3D rendering of stock market graphs with rising green lines, floating percentage symbols, and digital stock tickers, representing strong financial performance.
Коллекция по умолчанию
Коллекция по умолчанию
Создать новую

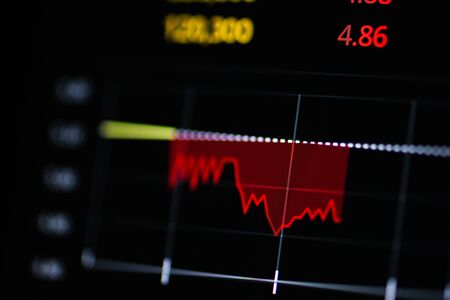
Financial data on a monitor,Stock market data on LED display concept
Коллекция по умолчанию
Коллекция по умолчанию
Создать новую

Vibrant candlestick patterns and descending trend lines illustrate a market downturn, highlighting analysis tools amid a somber financial atmosphere.
Коллекция по умолчанию
Коллекция по умолчанию
Создать новую

graph of financial growth on a computer monitor.
Коллекция по умолчанию
Коллекция по умолчанию
Создать новую
The dynamics of changes in currencies. Price growth chart and economic recovery
Коллекция по умолчанию
Коллекция по умолчанию
Создать новую
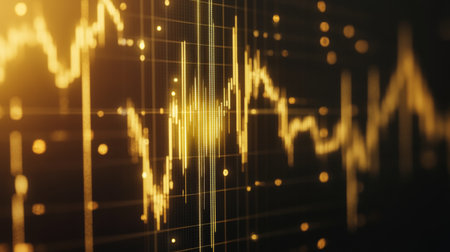
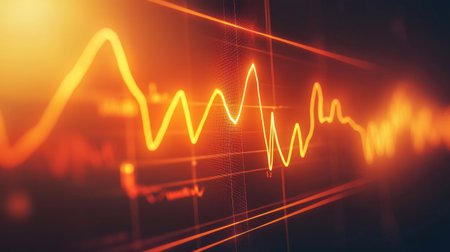
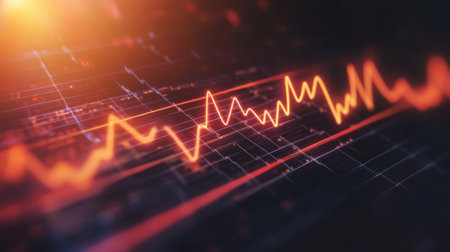
A striking abstract digital data visualization featuring a bright orange waveform. The design captures the essence of modern technology and digital analysis, perfect for projects related to data science.
Коллекция по умолчанию
Коллекция по умолчанию
Создать новую
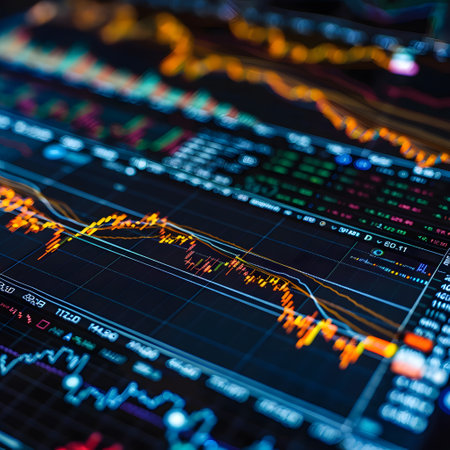
Abstract image of financial data and stock market analysis with colorful graphs and charts, representing economic trends and market fluctuations.
Коллекция по умолчанию
Коллекция по умолчанию
Создать новую
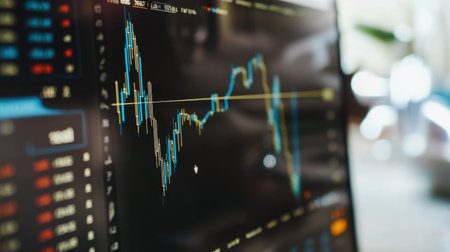
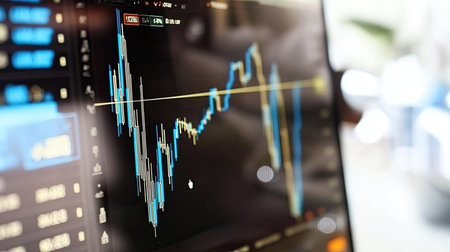
A zoomed-in view of a real-time stock market chart being displayed on a computer monitor, A chart displaying the correlations between different financial markets, AI Generated
Коллекция по умолчанию
Коллекция по умолчанию
Создать новую

silver robot teacher at a blackboard with his gun doors open
Коллекция по умолчанию
Коллекция по умолчанию
Создать новую

Image of media icons over diagrams on black background. Technology, business and digital interface concept digitally generated image.
Коллекция по умолчанию
Коллекция по умолчанию
Создать новую

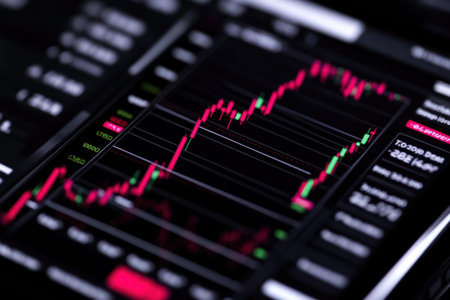
A detailed close-up view of a candlestick chart displaying stock data. The graphic illustrates financial trends with vibrant colors, aiding data analysis.
Коллекция по умолчанию
Коллекция по умолчанию
Создать новую
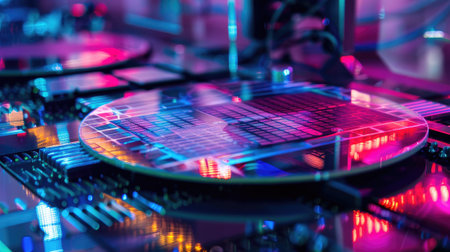
Robotic manufacturing of semiconductors and computer chips from silicon wafers. Modern technology concept
Коллекция по умолчанию
Коллекция по умолчанию
Создать новую

Explore a captivating abstract representation of data visualization with vibrant blue lines and dots, illustrating digital connections and signals in a modern technology-inspired design.
Коллекция по умолчанию
Коллекция по умолчанию
Создать новую
graph of financial growth on a computer monitor. cryptocurrency.
Коллекция по умолчанию
Коллекция по умолчанию
Создать новую
A vibrant trading interface showcasing cryptocurrency and stock market data, including price charts and dynamic analytics, ideal for depicting investment technology or financial analysis in a global market.
Коллекция по умолчанию
Коллекция по умолчанию
Создать новую
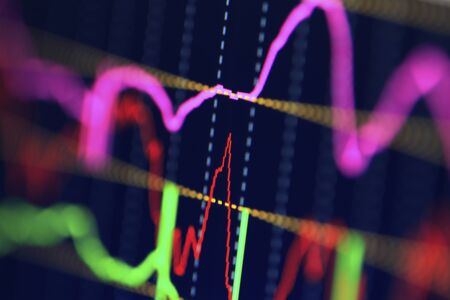
Colorful abstract graph showcasing data trends with fluctuating lines. Ideal for finance and technology themes, emphasizing analysis and visualization.
Коллекция по умолчанию
Коллекция по умолчанию
Создать новую
This abstract illustration features a glowing waveform on a dark background. It symbolizes health, technology, and energy, perfect for digital projects.
Коллекция по умолчанию
Коллекция по умолчанию
Создать новую
Bear market rebound vibrant blue graphs in the glow of sunrise, captured from a downward angle
Коллекция по умолчанию
Коллекция по умолчанию
Создать новую
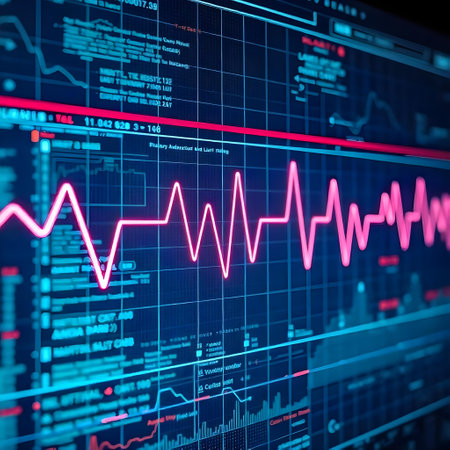
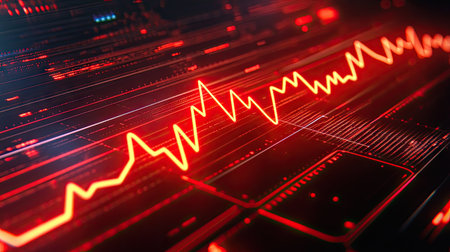
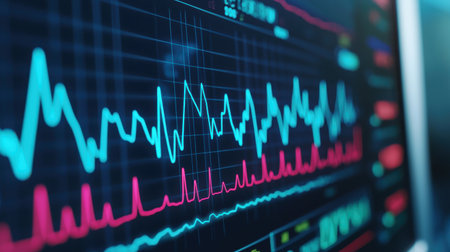
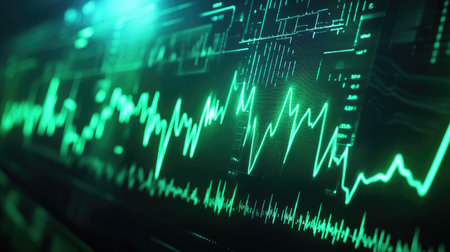
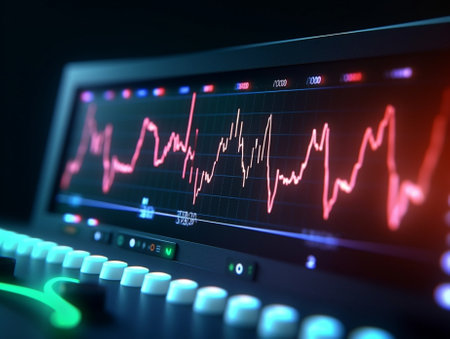
A Digital heartbeat visualization with vibrant red lines and data graphs
Коллекция по умолчанию
Коллекция по умолчанию
Создать новую
A detailed shot of a heart rate monitor screen with a visible heartbeat graph, highlighting the real-time display of heart rhythms in a clinical environment.
Коллекция по умолчанию
Коллекция по умолчанию
Создать новую
Laptop screen with stock market charts. Technical analysis and fundamental indicators of stock quotes in the trading terminal. Japanese candlesticks and company tickers.
Коллекция по умолчанию
Коллекция по умолчанию
Создать новую
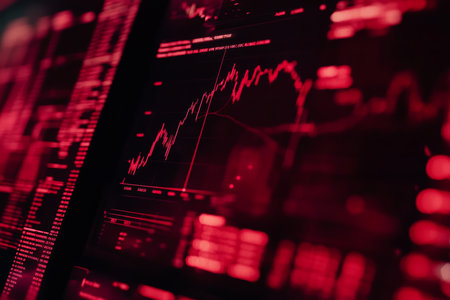
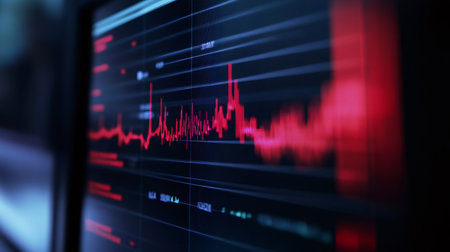
Glowing Red Volatility Graph Shows Downturn In Financial Market Analytics Over Grid Data.
Коллекция по умолчанию
Коллекция по умолчанию
Создать новую
Stock market data analyzing graph showing on laptop screen with shallow depth of field
Коллекция по умолчанию
Коллекция по умолчанию
Создать новую

The Stock Exchange, Streaming Trade Screen, The stock screen shows a list of stocks with reduced value.
Коллекция по умолчанию
Коллекция по умолчанию
Создать новую
Financial chart with pen, stock analysis data for business background on digital screen. Graphs of the growth of the financial market forex. trading candlestick chart
Коллекция по умолчанию
Коллекция по умолчанию
Создать новую
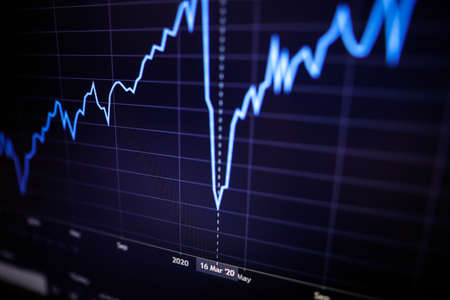
Shallow depth of field (selective focus) with details of a chart showing the stock market crash from March 2020 due to the Covid-19 pandemic on a computer screen (S&P500 index)
Коллекция по умолчанию
Коллекция по умолчанию
Создать новую
Stock price graph
Коллекция по умолчанию
Коллекция по умолчанию
Создать новую
A close-up of a heartbeat waveform on a medical display, capturing the moment of a pulse, with soft lighting enhancing the technological aspect
Коллекция по умолчанию
Коллекция по умолчанию
Создать новую
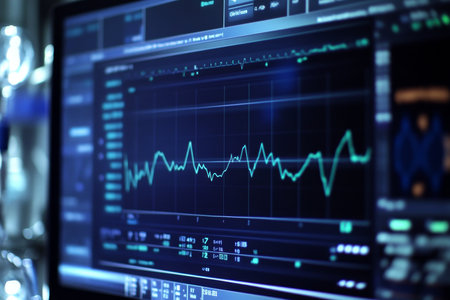
Digital screen showing fluctuating heart rate lines in green, representing irregular heartbeat or arrhythmia monitoring. Medical analysis in progress.
Коллекция по умолчанию
Коллекция по умолчанию
Создать новую
Colorful Data Visualization with Line Graphs and Digital Display of Stock Market Trends and Analysis for Financial Insights
Коллекция по умолчанию
Коллекция по умолчанию
Создать новую
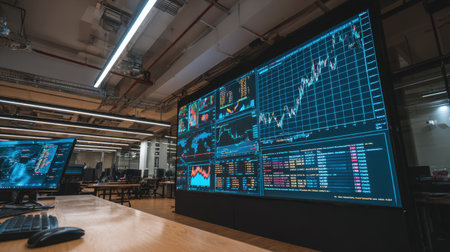
A modern financial office featuring large display screens with stock market trends and analytics, showcasing real-time data in a sleek and contemporary environment.
Коллекция по умолчанию
Коллекция по умолчанию
Создать новую
Stock exchange, cryptocurrency price chart on a screen. Candlestick chart, btc. Online currency exchange market. Trading, bidding. Tracking the cryptocurrency rate. 4K. Close up.
Коллекция по умолчанию
Коллекция по умолчанию
Создать новую

AI Generated. bright blue light rays abstract cosmic background
Коллекция по умолчанию
Коллекция по умолчанию
Создать новую
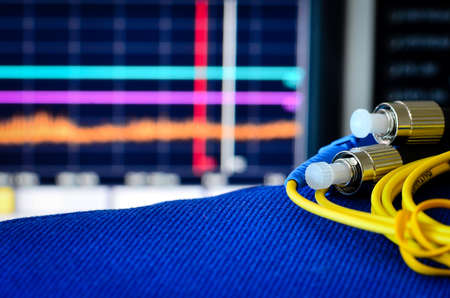
Fibre optic cable with spectrum analyser in the background
Коллекция по умолчанию
Коллекция по умолчанию
Создать новую
Electrocardiogram on a black background, 3d render
Коллекция по умолчанию
Коллекция по умолчанию
Создать новую
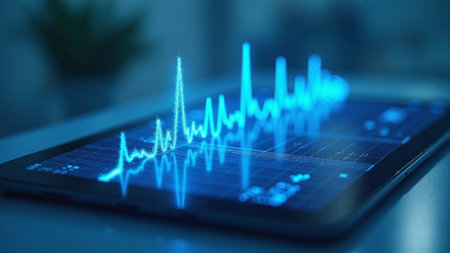
Modern digital healthcare tablet with abstract medical pulse waves on blue screen
Коллекция по умолчанию
Коллекция по умолчанию
Создать новую

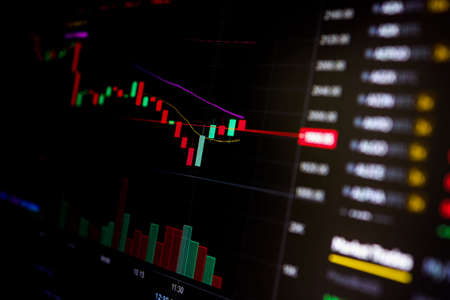
Candle stick graph chart with indicator showing bullish point or bearish point, up trend or down trend of price of stock market or stock exchange trading, investment and financial concept.
Коллекция по умолчанию
Коллекция по умолчанию
Создать новую
Color grading graph or RGB colour correction indicator on monitor in post production process. Telecine stage in video or film production processing. for colorist edit or adjust color on digital movie.
Коллекция по умолчанию
Коллекция по умолчанию
Создать новую
Digital screen showing fluctuating heart rate lines in green, representing irregular heartbeat or arrhythmia monitoring. Medical analysis in progress.
Коллекция по умолчанию
Коллекция по умолчанию
Создать новую
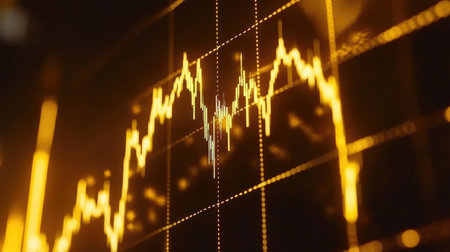
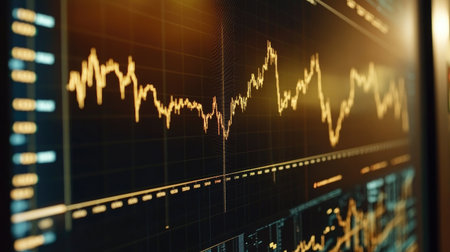
A vibrant financial graph displaying data trends with golden highlights. Perfect for showcasing market analysis, investment insights, and economic performance.
Коллекция по умолчанию
Коллекция по умолчанию
Создать новую
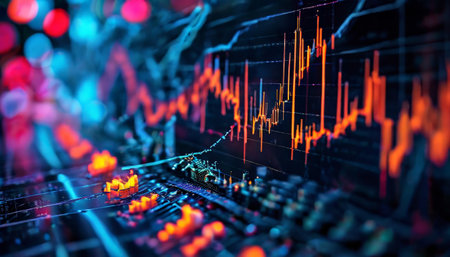
A futuristic stock market graph with neon lines showing market fluctuations. The background includes ticker symbols and financial data streams, emphasizing volatility and growth.
Коллекция по умолчанию
Коллекция по умолчанию
Создать новую
A line chart index for the past 10 years with a green background and a yellow line.
Коллекция по умолчанию
Коллекция по умолчанию
Создать новую

Business financial or stock market background. Business graph on stock market financial exchange
Коллекция по умолчанию
Коллекция по умолчанию
Создать новую
A computer monitor displays a graph of stock prices. The graph shows a downward trend, with the stock prices dropping significantly. Scene is one of concern and uncertainty
Коллекция по умолчанию
Коллекция по умолчанию
Создать новую

Wave particles with the shape of sphere, 3d rendering. Computer digital drawing.
Коллекция по умолчанию
Коллекция по умолчанию
Создать новую
Stock Market Chart on Dark Background: Financial Analytics. Digital Art: Modern Technologies
Коллекция по умолчанию
Коллекция по умолчанию
Создать новую

Indicators including volume analysis for professional technical analysis on the monitor of a computer. Fundamental and technical analysis concept.
Коллекция по умолчанию
Коллекция по умолчанию
Создать новую
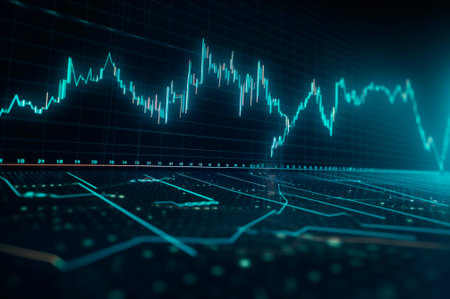
graph design, statistical diagram neon blue lighting with financial indicators of stock market and investment. AI generated. perspective view
Коллекция по умолчанию
Коллекция по умолчанию
Создать новую
writing physical formula on post-it note
Коллекция по умолчанию
Коллекция по умолчанию
Создать новую

A captivating digital image depicting abstract data waves and fluctuating signals that represent modern technological innovation and connectivity in a dark setting.
Коллекция по умолчанию
Коллекция по умолчанию
Создать новую
Stock market data graph on monitor. Business and financial investment concept.
Коллекция по умолчанию
Коллекция по умолчанию
Создать новую
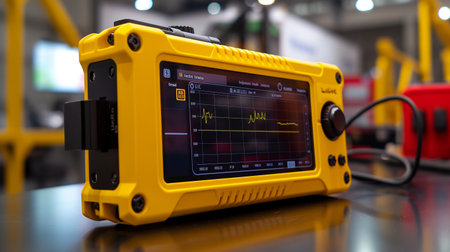
Digital multimeter for measuring the parameters of the machine. 3d rendering
Коллекция по умолчанию
Коллекция по умолчанию
Создать новую
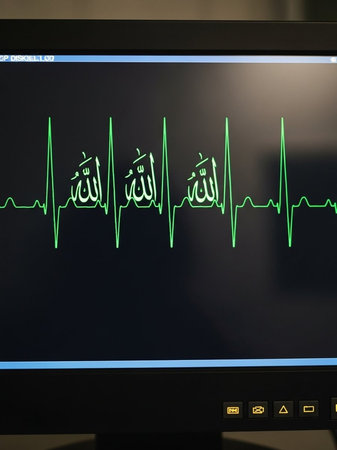
A computer screen displays a green ECG heartbeat line with Arabic calligraphy
Коллекция по умолчанию
Коллекция по умолчанию
Создать новую
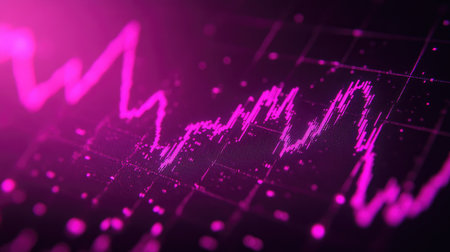
A captivating digital artwork depicting vibrant pink and blue elements on graphs, illustrating financial trends and market analysis for modern technology applications.
Коллекция по умолчанию
Коллекция по умолчанию
Создать новую
apparatus or device the unit of measurement of the electrocardiogram in a doctors office Male patient having ECG electrocardiogram in hospital selective focus : Generative AI
Коллекция по умолчанию
Коллекция по умолчанию
Создать новую
Vibrant abstract visualization showcasing fluctuating data trends in vivid orange lines, emphasizing the interplay of technology and innovation in a digital landscape.
Коллекция по умолчанию
Коллекция по умолчанию
Создать новую
3d rendering of abstract technology background with glowing neon lines and waves
Коллекция по умолчанию
Коллекция по умолчанию
Создать новую
A detailed financial chart with currency trading trends and technical analysis tools for investors focused on maximizing portfolio profitability --chaos 70
Коллекция по умолчанию
Коллекция по умолчанию
Создать новую
Close up of a stock market chart on a computer screen. 3d rendering
Коллекция по умолчанию
Коллекция по умолчанию
Создать новую

finance statistic at the screen
Коллекция по умолчанию
Коллекция по умолчанию
Создать новую
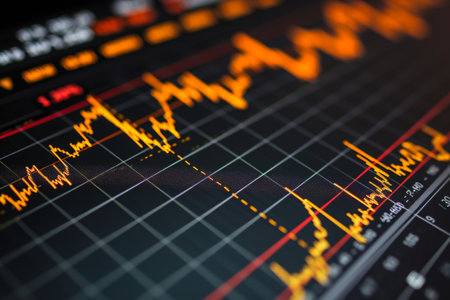
A close-up view of an interactive stock trading chart on a tablet, showing candlestick patterns and technical indicators in a well-lit environment.
Коллекция по умолчанию
Коллекция по умолчанию
Создать новую
Legion-Media
Создайте свои проекты на основе качественных стоковых фотографий и видео.


Copyright © Legion-Media.