
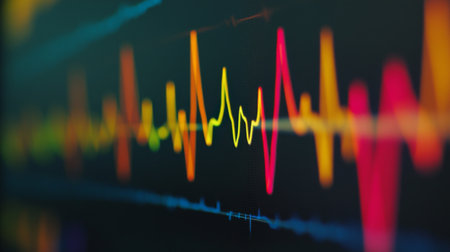
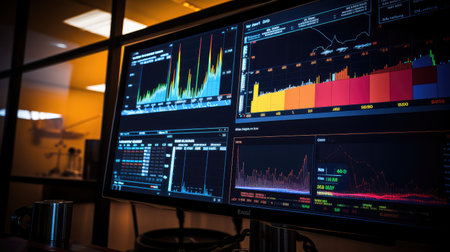
Audio Visual Media, Brightly Colored Sound Spectrum and Waves, Broadcasting Background
Коллекция по умолчанию
Коллекция по умолчанию
Создать новую
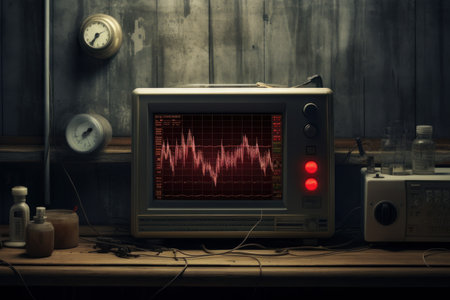
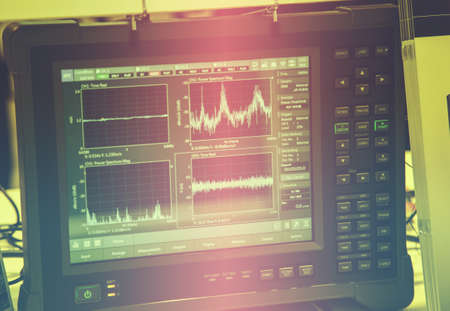
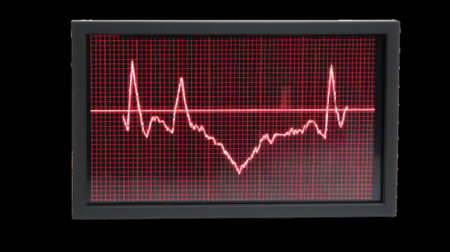
Cumbersome Ekg old monitor. Vital instrument. Generate Ai
Коллекция по умолчанию
Коллекция по умолчанию
Создать новую

mysterious optical illusion on computer screen in office desk despite the dull blurry landscape outside the window
Коллекция по умолчанию
Коллекция по умолчанию
Создать новую
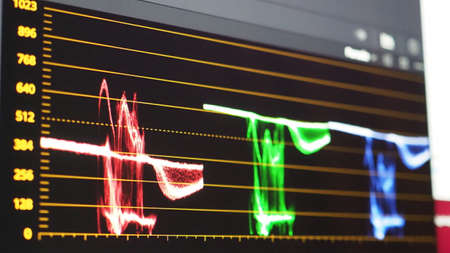
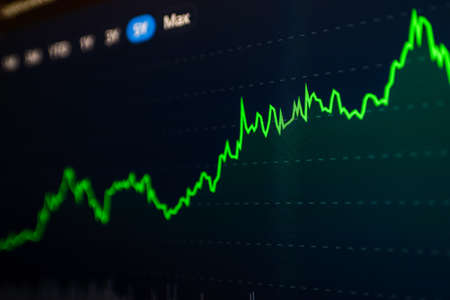
Color grading graph or RGB colour correction indicator on monitor in post production process. Telecine stage in video or film production processing. for colorist edit or adjust color on digital movie.
Коллекция по умолчанию
Коллекция по умолчанию
Создать новую
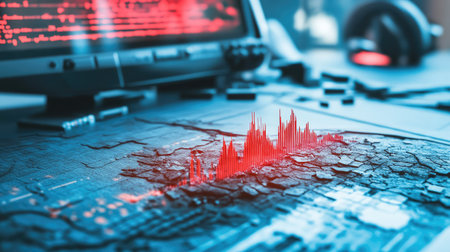
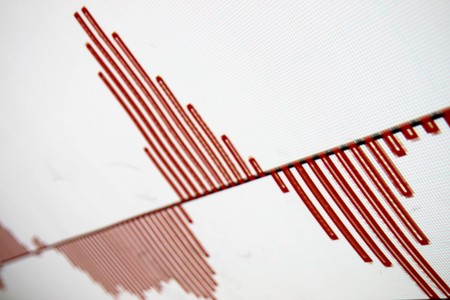
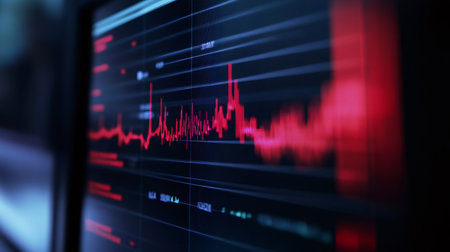
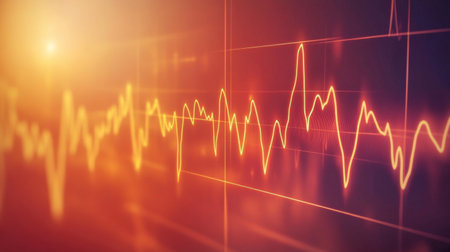
A dynamic abstract sound wave visualization rendered in striking red, set against a modern digital workspace, showcasing technology and creativity.
Коллекция по умолчанию
Коллекция по умолчанию
Создать новую
Audio sound wave studio editing computer program screen showings sounds on screen from vocal recording of voiceover.
Коллекция по умолчанию
Коллекция по умолчанию
Создать новую
A close-up view of an electrocardiogram ECG monitor displaying a heart wave pattern, with vibrant lines showing the rhythm of a beating heart against a dark background
Коллекция по умолчанию
Коллекция по умолчанию
Создать новую

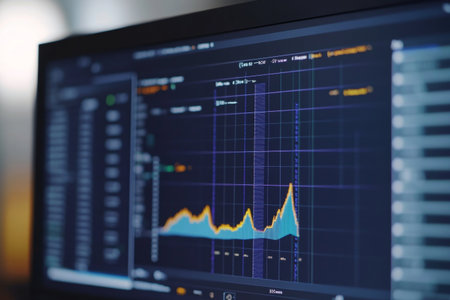
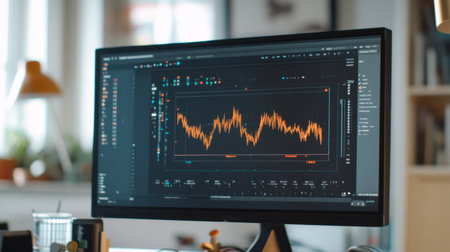
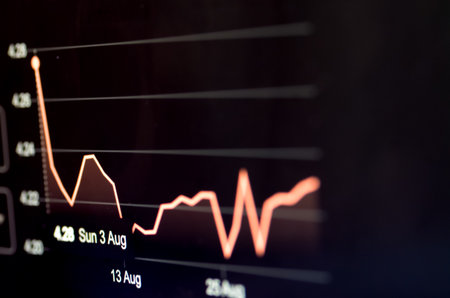
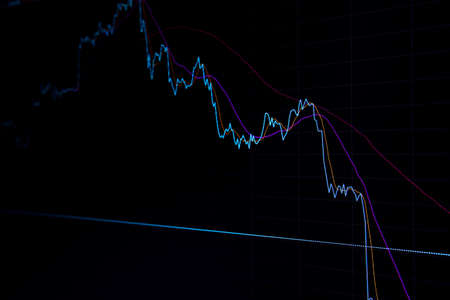
Shallow depth of field (selective focus) with details of a chart showing the stock market crash from March 2020 due to the Covid-19 pandemic on a computer screen (S&P500 index)
Коллекция по умолчанию
Коллекция по умолчанию
Создать новую
Audio sound wave studio editing computer program screen showings sounds on screen from vocal recording of voiceover.
Коллекция по умолчанию
Коллекция по умолчанию
Создать новую
financial graph of investment growth
Коллекция по умолчанию
Коллекция по умолчанию
Создать новую
charts oil rig data
Коллекция по умолчанию
Коллекция по умолчанию
Создать новую
close-up of the robot control panel at the exhibition
Коллекция по умолчанию
Коллекция по умолчанию
Создать новую
Red seismic waves pulsating on a dark monitoring screen indicate ongoing earthquake activity, providing crucial real time data for geologists and researchers
Коллекция по умолчанию
Коллекция по умолчанию
Создать новую

Color grading monitor. RGB colour correction indicator graph on screen in post production process. Telecine stage in video or film production processing. for colorist edit or adjust on digital movie.
Коллекция по умолчанию
Коллекция по умолчанию
Создать новую
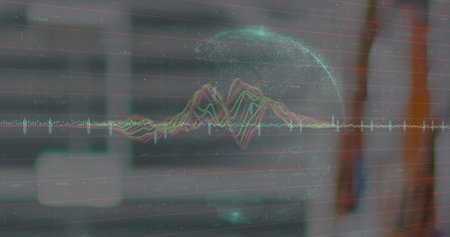
Image of data processing over empty warehouse.
Коллекция по умолчанию
Коллекция по умолчанию
Создать новую
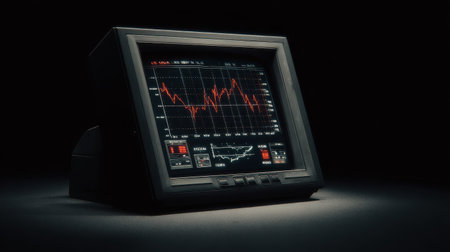
Vintage computer monitor displaying stock market data with fluctuating graph lines and financial statistics on a dark background, capturing retro technology aesthetics
Коллекция по умолчанию
Коллекция по умолчанию
Создать новую
Seismic activity earthquake Tokelau map Richter scale
Коллекция по умолчанию
Коллекция по умолчанию
Создать новую

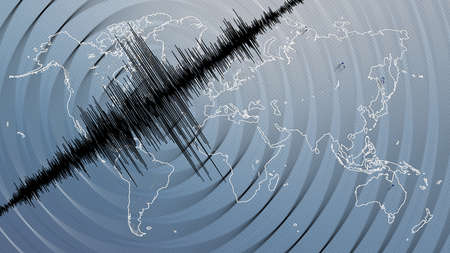
Red seismic wave over Myanmar map
Коллекция по умолчанию
Коллекция по умолчанию
Создать новую
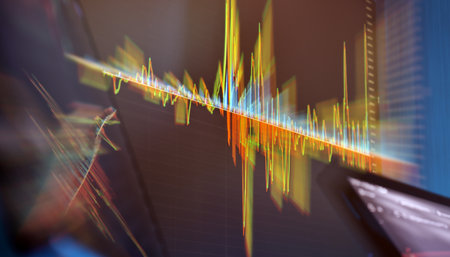
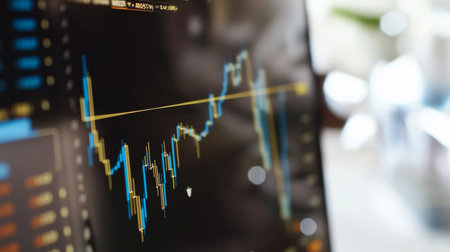
Dynamic close-up of a colorful financial chart with motion blur effect, symbolizing market volatility, trading speed, and data intensity.
Коллекция по умолчанию
Коллекция по умолчанию
Создать новую
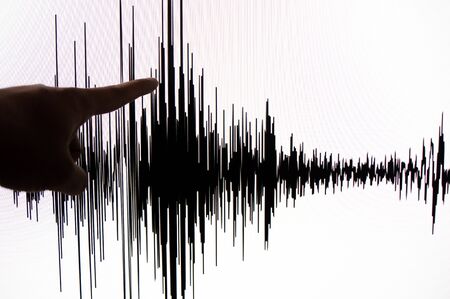
Photograph of a person using his hand to point on the white screen with a graph or seismograph in black colour
Коллекция по умолчанию
Коллекция по умолчанию
Создать новую
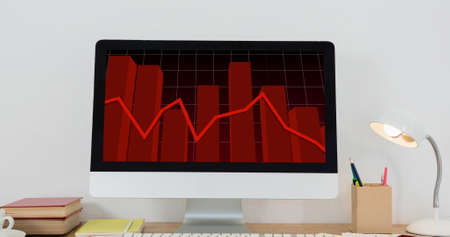
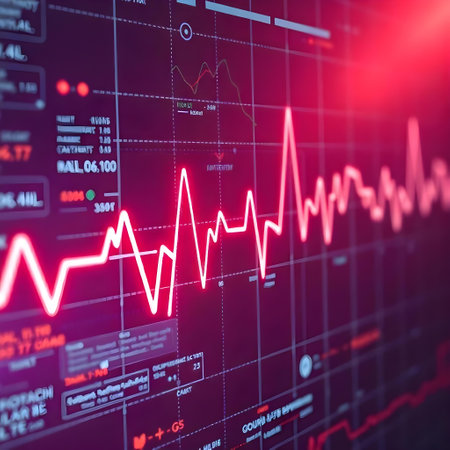
Image of financial data processing with red line over computer screen on desk. global business and finances, technology concept digitally generated image.
Коллекция по умолчанию
Коллекция по умолчанию
Создать новую
Glitch abstract background. Distortion texture. Blue white red noise on dust black copy space.
Коллекция по умолчанию
Коллекция по умолчанию
Создать новую
A close-up of a high-resolution computer screen reveals a detailed Python script focused on data cleaning and preprocessing techniques for data analysis.
Коллекция по умолчанию
Коллекция по умолчанию
Создать новую
Color grading graph or RGB colour correction indicator on monitor in post production process. Telecine stage in video or film production processing. for colorist edit or adjust color on digital movie.
Коллекция по умолчанию
Коллекция по умолчанию
Создать новую
Proffestional music recording sound wave lanes in the studio software
Коллекция по умолчанию
Коллекция по умолчанию
Создать новую
A close-up, dynamic shot of a glowing red and orange audio waveform and graphic equalizer on a digital screen. The image visually represents sound, frequency, and amplitude, capturing the energy of music or voice. It's an ideal visual for topics related to audio engineering, music production, podcasts, and sound technology.
Коллекция по умолчанию
Коллекция по умолчанию
Создать новую
Digital signal processing system with waveform analysis, filter settings, and output visualization on computer screen
Коллекция по умолчанию
Коллекция по умолчанию
Создать новую
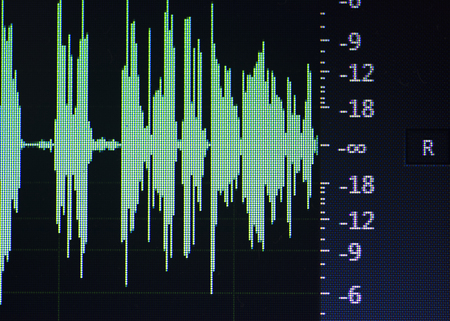
A bright green waveform, resembling a heartbeat, sound wave, or oscilloscope reading, is displayed on an old CRT monitor in a dark room. The shadowy silhouette of a person is faintly reflected on the screen, observing the signal. The image creates a sense of mystery, surveillance, or scientific observation.
Коллекция по умолчанию
Коллекция по умолчанию
Создать новую
Minimalist audio waveform in white lines on a dark background, symbolizing clarity and precision in sound editing
Коллекция по умолчанию
Коллекция по умолчанию
Создать новую

Color grading monitor. RGB colour correction indicator graph on screen in post production process. Telecine stage in video or film production processing. for colorist edit or adjust on digital movie.
Коллекция по умолчанию
Коллекция по умолчанию
Создать новую
Digital Finance: Analyzing Volatile Market Graphs and Managing Tiered Compensation Schedules on a Desktop.
Коллекция по умолчанию
Коллекция по умолчанию
Создать новую

Earthquake concept with text and red curve wave and circle vibration on dark world map background vector illustration design
Коллекция по умолчанию
Коллекция по умолчанию
Создать новую
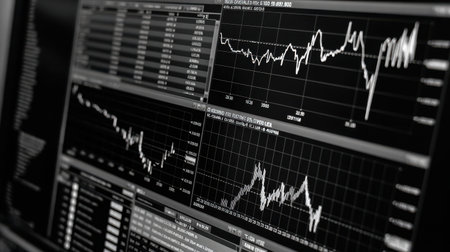
Black and white image of stock market charts showing price trends and fluctuations on digital display with financial data for analysis and review
Коллекция по умолчанию
Коллекция по умолчанию
Создать новую
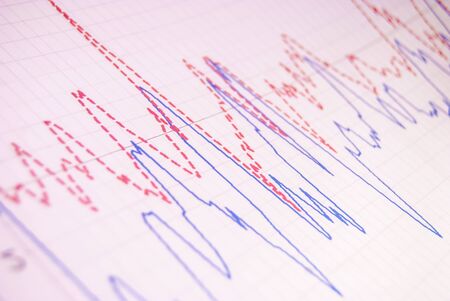
graph paper with financial diagram
Коллекция по умолчанию
Коллекция по умолчанию
Создать новую
Electrocardiogram on a white background, close-up
Коллекция по умолчанию
Коллекция по умолчанию
Создать новую
Vibrant Heartbeat Illustration showcases a red heart with a pulsating ECG line on a digital grid background. AI Generated
Коллекция по умолчанию
Коллекция по умолчанию
Создать новую

image is a graph of financial development on a computer monitor.
Коллекция по умолчанию
Коллекция по умолчанию
Создать новую

Financial graphs analysis and pen.
Коллекция по умолчанию
Коллекция по умолчанию
Создать новую
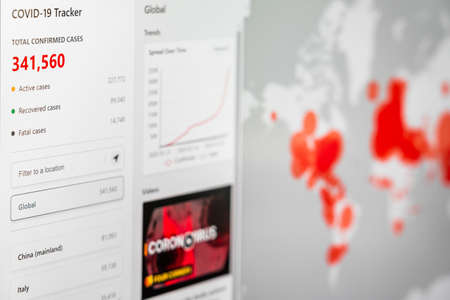
BUCHAREST, ROMANIA - MARCH 23, 2020: Coronavirus Total Cases Of The Pandemic Spreading All Around The Globe In March
Коллекция по умолчанию
Коллекция по умолчанию
Создать новую

Color grading graph or RGB colour correction indicator on monitor in post production process. Telecine stage in video or film production processing. for colorist edit or adjust color on digital movie.
Коллекция по умолчанию
Коллекция по умолчанию
Создать новую
lcd monitor with a line graph, Generative AI Art Illustration
Коллекция по умолчанию
Коллекция по умолчанию
Создать новую
Currency growth chart online. Phone with a schedule. financial concept. 3d rendering.
Коллекция по умолчанию
Коллекция по умолчанию
Создать новую
Displaying blue waveform oscillating across digital interface, with 74% gauge and world map heatmap. Technology, analytics, interface, data visualization, futuristic, cybersecurity, digital environment
Коллекция по умолчанию
Коллекция по умолчанию
Создать новую
A computer monitor displays a green ECG heartbeat line with Arabic script
Коллекция по умолчанию
Коллекция по умолчанию
Создать новую
Screen with stock market index charts and diagrams - ai
Коллекция по умолчанию
Коллекция по умолчанию
Создать новую

video editting timeline
Коллекция по умолчанию
Коллекция по умолчанию
Создать новую

image of the financial graph on a computer monitor.
Коллекция по умолчанию
Коллекция по умолчанию
Создать новую
Monitor screen glowing red with collapsing stock chart, economic failure, investment loss, and panic theme
Коллекция по умолчанию
Коллекция по умолчанию
Создать новую
Sound recording studio audio wave on computer screen in professional editing program for voice, vocal, dj deejay musical mixing
Коллекция по умолчанию
Коллекция по умолчанию
Создать новую
Displaying waveform chart on shaded wall with red grid lines, teal candlestick markers, axis labels. Data, visualization, infographics, analytics, digital, modern, technology
Коллекция по умолчанию
Коллекция по умолчанию
Создать новую
A close-up view of a modern medical monitor showing heart rate and vital signs in vibrant colors. The display highlights important healthcare data for patient monitoring.
Коллекция по умолчанию
Коллекция по умолчанию
Создать новую
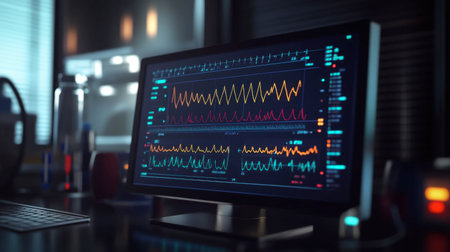
A modern monitor displays vibrant graphs and data visualizations, ideal for a technology-driven workspace. The colorful insights represent complex analysis and metrics.
Коллекция по умолчанию
Коллекция по умолчанию
Создать новую

Sound recording studio audio wave on computer screen in professional editing program for voice, vocal, dj deejay musical mixing
Коллекция по умолчанию
Коллекция по умолчанию
Создать новую
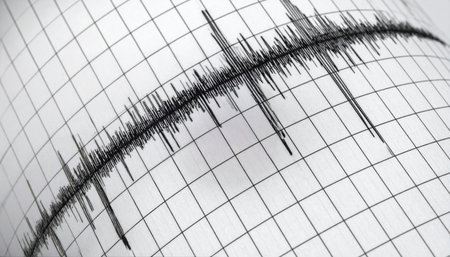
Seismograph paper with a bold earthquake wave line showing seismic activity.
Коллекция по умолчанию
Коллекция по умолчанию
Создать новую

Vibrant Heartbeat Illustration showcases a red heart with a pulsating ECG line on a digital grid background. AI Generated
Коллекция по умолчанию
Коллекция по умолчанию
Создать новую
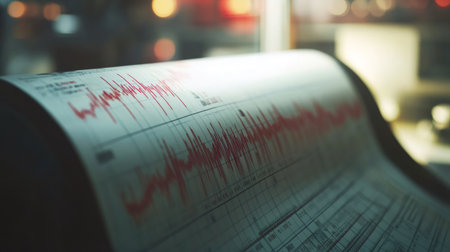
Seismograph needle drawing seismic waves on a roll of paper, recording ground motion during an earthquake event, providing crucial data for geologists and scientists
Коллекция по умолчанию
Коллекция по умолчанию
Создать новую
The old concrete bridge on the street in the city, Thailand.
Коллекция по умолчанию
Коллекция по умолчанию
Создать новую

Audio studio digital voice recording voiceover sound wave on computer screen.
Коллекция по умолчанию
Коллекция по умолчанию
Создать новую

A striking abstract visualization of audio waveforms on a modern desktop setting, showcasing vibrant red colors against a textured background, ideal for digital design themes.
Коллекция по умолчанию
Коллекция по умолчанию
Создать новую
Composite of landscape and data processing. Global networks, connections and data processing concept digitally generated image.
Коллекция по умолчанию
Коллекция по умолчанию
Создать новую
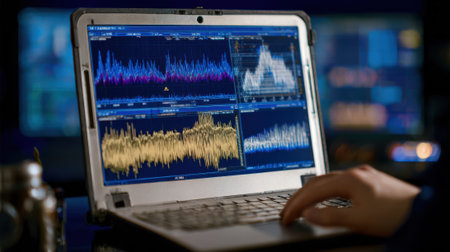
Specialist analyzing digital broadcast signal quality on a laptop with waveform graphs and frequency data displayed clearly on screen.
Коллекция по умолчанию
Коллекция по умолчанию
Создать новую

Financial data processing over cityscape against dark background. global finance and digital interface technology concept
Коллекция по умолчанию
Коллекция по умолчанию
Создать новую
Closeup financial chart in stock market on monitor background. Chart graph as investment concept. Crisis background, red chart
Коллекция по умолчанию
Коллекция по умолчанию
Создать новую
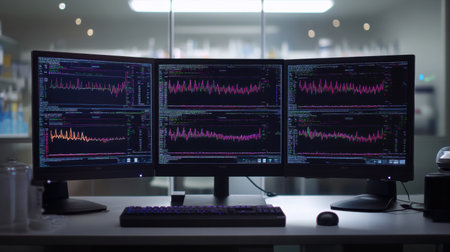
A modern workspace featuring multiple monitors showing analytical data and graphs, ideal for professionals in finance, technology, and research sectors focused on data analysis.
Коллекция по умолчанию
Коллекция по умолчанию
Создать новую

Earthquake Concept - Orange light line Frequency seismograph waves cracked and Circle Vibration on perspective grid and black background Vector illustration design
Коллекция по умолчанию
Коллекция по умолчанию
Создать новую

Glitch texture creating abstract patterns in distorted digital noise
Коллекция по умолчанию
Коллекция по умолчанию
Создать новую
graph finance yellow
Коллекция по умолчанию
Коллекция по умолчанию
Создать новую
Computer glowing forex index chart with grid on blurry background. Market, finance. AI Generated
Коллекция по умолчанию
Коллекция по умолчанию
Создать новую
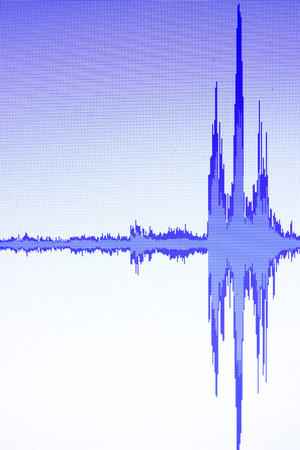
Vibrant purple data wave with a sharp peak moving across a dark, futuristic digital grid, symbolizing complex data patterns, financial trends, technology, or health monitoring.
Коллекция по умолчанию
Коллекция по умолчанию
Создать новую
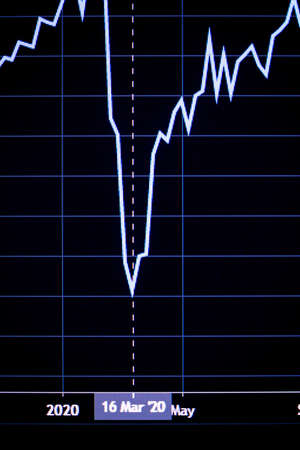
Shallow depth of field (selective focus) with details of a chart showing the stock market crash from March 2020 due to the Covid-19 pandemic on a computer screen (S&P500 index)
Коллекция по умолчанию
Коллекция по умолчанию
Создать новую

Stock market graph on screen. Ticker on monitor screen. Investing, Finance and Economic concept. Shallow depth of field.
Коллекция по умолчанию
Коллекция по умолчанию
Создать новую

Abstract black seismogram on white paper background
Коллекция по умолчанию
Коллекция по умолчанию
Создать новую
Heavy Ekg old monitor. Vital instrument. Generate AI
Коллекция по умолчанию
Коллекция по умолчанию
Создать новую
Earthquake wave graph concept image
Коллекция по умолчанию
Коллекция по умолчанию
Создать новую
Graphic of the market volatility of crypto trading with multiple technical graphs and indicators, for analysis up and downtrend. Cryptocurrency background concept. Focus on part graph.
Коллекция по умолчанию
Коллекция по умолчанию
Создать новую
Close-up view of a vintage medical monitor showcasing waveform data, surrounded by industrial tools and equipment in a professional setting.
Коллекция по умолчанию
Коллекция по умолчанию
Создать новую
Financial Downturn Graphs in Realistic Detail
Коллекция по умолчанию
Коллекция по умолчанию
Создать новую
High tech interface displaying scientific data analysis
Коллекция по умолчанию
Коллекция по умолчанию
Создать новую
Geologist is analyzing seismic waves on seismograph chart after earthquake, studying magnitude and frequency for geological research and risk assessment
Коллекция по умолчанию
Коллекция по умолчанию
Создать новую

A closeup of lie detector machine needles drawing blue lines on graph paper depicting an interrogation - 3D render
Коллекция по умолчанию
Коллекция по умолчанию
Создать новую
ultrasound medical equipments
Коллекция по умолчанию
Коллекция по умолчанию
Создать новую
li-fi signal symbol on a digital screen, created with generative ai
Коллекция по умолчанию
Коллекция по умолчанию
Создать новую
Electric current, energy wave, EQ graph, technology background, 3D illustration
Коллекция по умолчанию
Коллекция по умолчанию
Создать новую
Grow Stock market trading graph in graphic concept.financial investment or economic trends business design. Abstract finance background.Low angle shot.
Коллекция по умолчанию
Коллекция по умолчанию
Создать новую

A powerful 7.4 earthquake strikes causing significant destruction and impacting lives.
Коллекция по умолчанию
Коллекция по умолчанию
Создать новую
Pressure
Коллекция по умолчанию
Коллекция по умолчанию
Создать новую
graph paper with financial diagram
Коллекция по умолчанию
Коллекция по умолчанию
Создать новую
securities price chart on the monitor screen
Коллекция по умолчанию
Коллекция по умолчанию
Создать новую

Earthquake background. seismogram for seismic measurement.
Коллекция по умолчанию
Коллекция по умолчанию
Создать новую
Close-up of a financial graph on a computer screen, showcasing upward and downward trends with detailed line and bar charts.
Коллекция по умолчанию
Коллекция по умолчанию
Создать новую
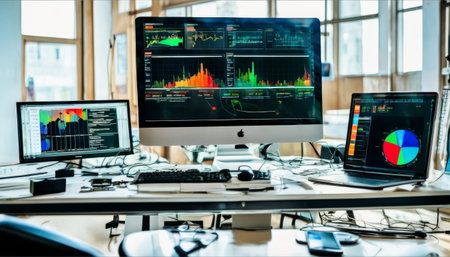
A detailed workspace with several monitors displaying financial data, graphs, and analysis tools in a well-lit office setting.. AI Generation
Коллекция по умолчанию
Коллекция по умолчанию
Создать новую
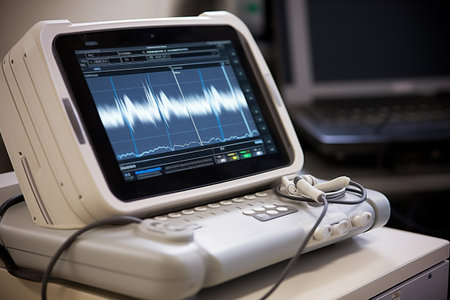
Ultrasound machine in hospital. Medical equipment. Screen with medical indications. Generative AI
Коллекция по умолчанию
Коллекция по умолчанию
Создать новую

Recording studio digital mixing desk screen used to mix voiceover voice, singing and music.
Коллекция по умолчанию
Коллекция по умолчанию
Создать новую
A heart rate graph with an irregular heartbeat pattern, highlighting fluctuations and anomalies, set against a neutral background.
Коллекция по умолчанию
Коллекция по умолчанию
Создать новую
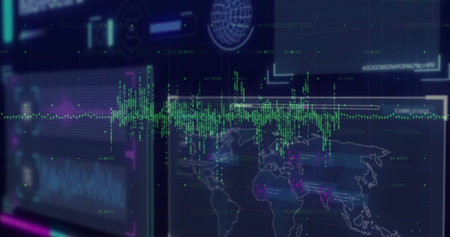
Displaying green waveform line graph running across dashboard in control room, with world map panel. Technology, data, visualization, futurism, analytics, digital, innovation
Коллекция по умолчанию
Коллекция по умолчанию
Создать новую
Heart monitor showing heartbeat and transparent background
Коллекция по умолчанию
Коллекция по умолчанию
Создать новую
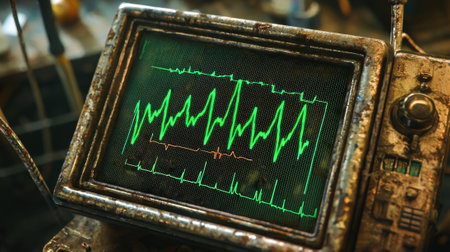
Fluctuating green waveforms are displayed on an aged electronic monitor in a cluttered laboratory. Various instruments and equipment surround the monitor, highlighting an experimental atmosphere.
Коллекция по умолчанию
Коллекция по умолчанию
Создать новую
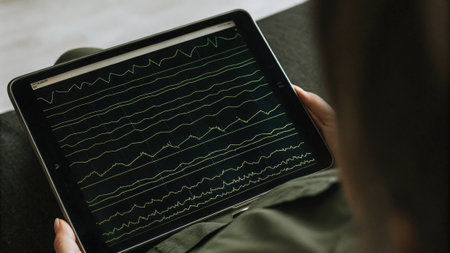
A closeup of the EEG sensor interface displaying realtime brainwave data on a tablet screen showing spikes and waves as the user meditates with the sensor visibly attached to their.
Коллекция по умолчанию
Коллекция по умолчанию
Создать новую
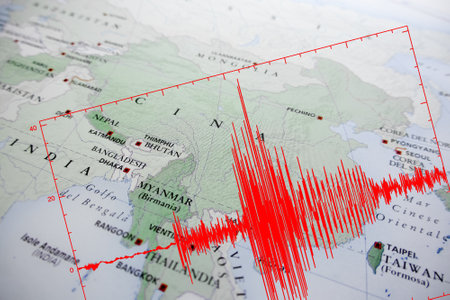
Red seismic wave over Myanmar map
Коллекция по умолчанию
Коллекция по умолчанию
Создать новую
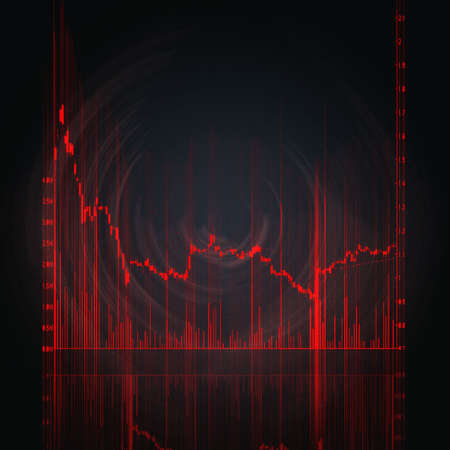
illustration of the red stock market chart
Коллекция по умолчанию
Коллекция по умолчанию
Создать новую
Legion-Media
Создайте свои проекты на основе качественных стоковых фотографий и видео.


Copyright © Legion-Media.