
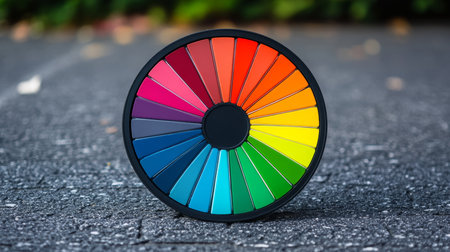
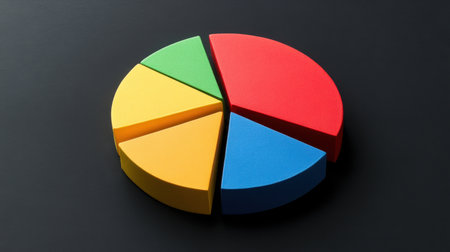
Top view statistics presentation Set
Коллекция по умолчанию
Коллекция по умолчанию
Создать новую
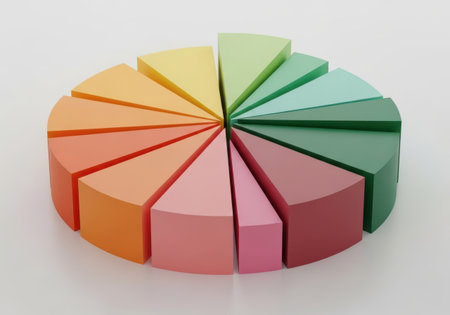
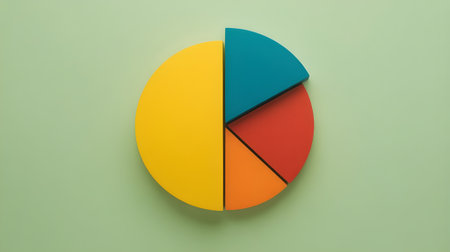
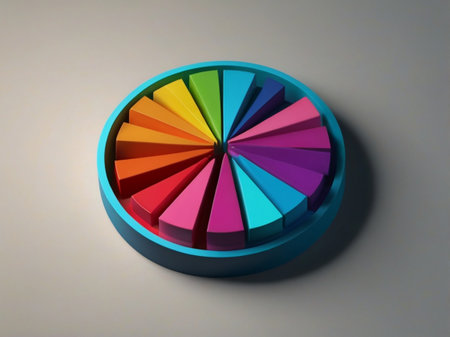
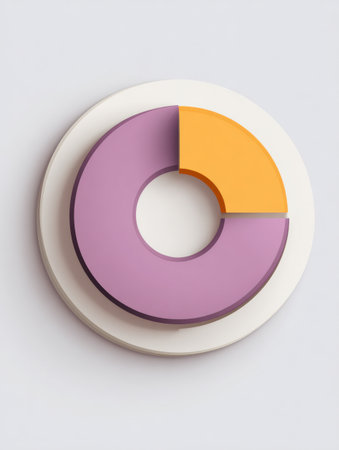
Circular chart with shadow effects and 3D depth, realistic and impactful
Коллекция по умолчанию
Коллекция по умолчанию
Создать новую

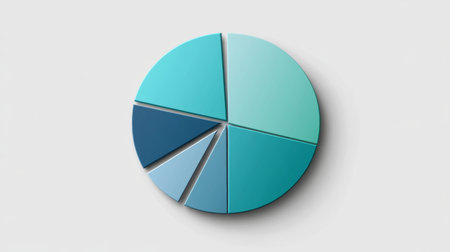
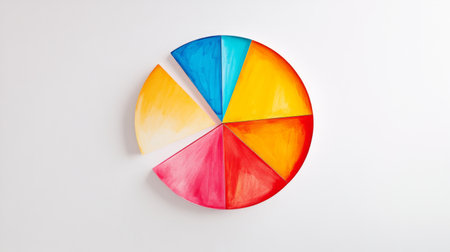
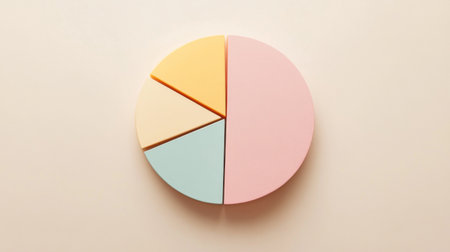
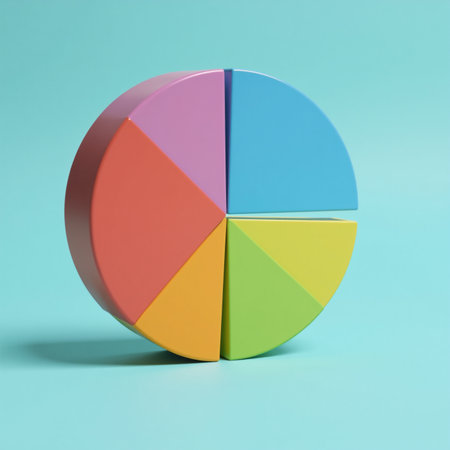
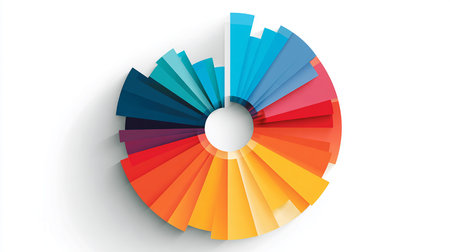
A creative pie chart with textured segments showing sales data, each slice representing a different product line, set against a rustic wooden table background.
Коллекция по умолчанию
Коллекция по умолчанию
Создать новую

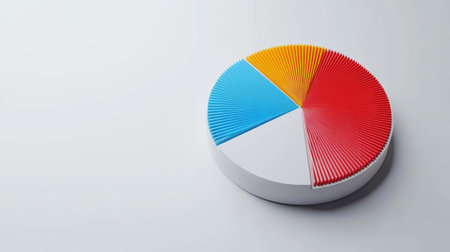
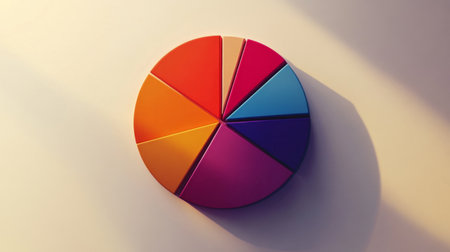
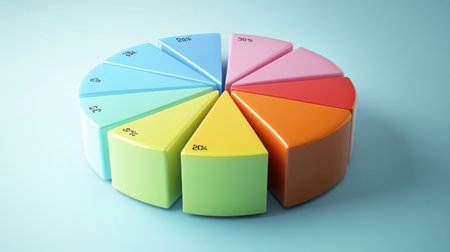
Stats concept with wood pie chart
Коллекция по умолчанию
Коллекция по умолчанию
Создать новую

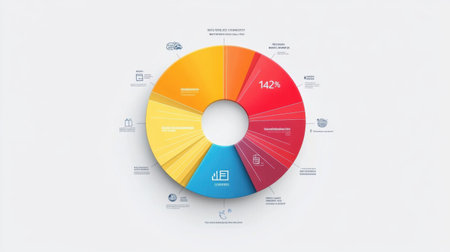
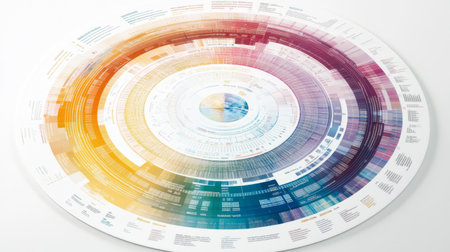
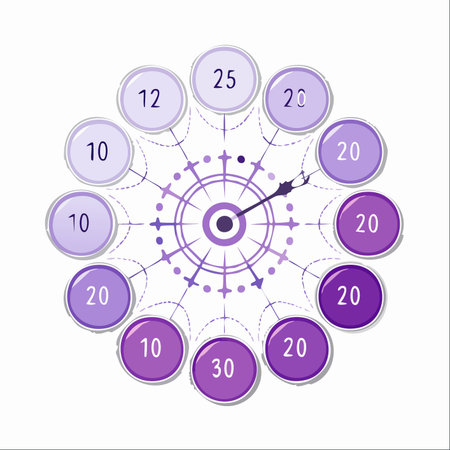
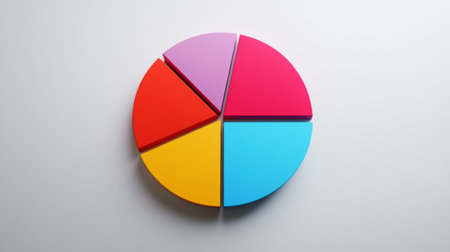
An AI generated illustration of project management graphs charts paper
Коллекция по умолчанию
Коллекция по умолчанию
Создать новую
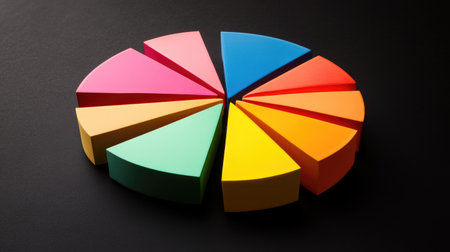
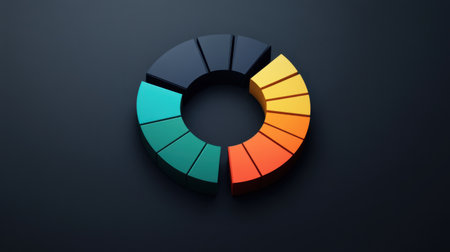
This image features a colorful segmented circle design against a dark background, perfect for creative projects, educational materials, or graphic designs.
Коллекция по умолчанию
Коллекция по умолчанию
Создать новую
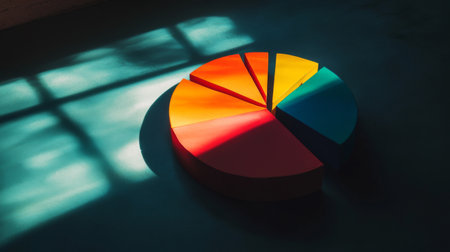
A colorful pie chart casts striking shadows on a surface, showcasing modern design and vibrant colors. Ideal for business or creative visualizations.
Коллекция по умолчанию
Коллекция по умолчанию
Создать новую
A divided pie chart in vibrant orange and blue colors placed against a light background illustrating data segmentation.
Коллекция по умолчанию
Коллекция по умолчанию
Создать новую

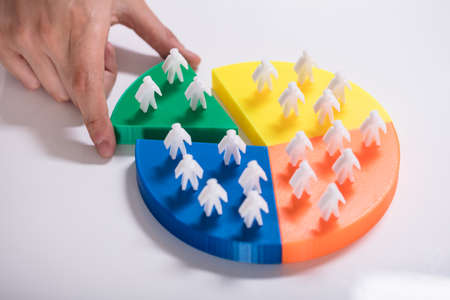
Colorful fraction circles arranged into a circle graph and hand, black background.
Коллекция по умолчанию
Коллекция по умолчанию
Создать новую

3d pie chart showcasing business data percentages, set against a seamless gradient background
Коллекция по умолчанию
Коллекция по умолчанию
Создать новую
A vibrant pie chart infographic showcasing diverse data segments, ideal for business presentations, data analysis projects, and engagement visualizations.
Коллекция по умолчанию
Коллекция по умолчанию
Создать новую

3d illustration of a multicolored circle divided into a large number of sectors on a yellow isolated background. Round chart
Коллекция по умолчанию
Коллекция по умолчанию
Создать новую

A colorful circular wooden plate with segmented colors rests on a dark wood surface, showcasing vibrant artistic craftsmanship and modern design elements.
Коллекция по умолчанию
Коллекция по умолчанию
Создать новую

A vibrant circular shape held in a hand, showcasing various sections of bright colors. Ideal for design projects, creative concepts, and artistic inspiration.
Коллекция по умолчанию
Коллекция по умолчанию
Создать новую

pie chart divided into slices to represent different aspects of innovation within a business concept, such as product, process, and service innovation.
Коллекция по умолчанию
Коллекция по умолчанию
Создать новую
Colorful pie chart showing market share and business performance
Коллекция по умолчанию
Коллекция по умолчанию
Создать новую

Pie charts representing diversified stock portfolios, diversification of investment or asset allocation on stock and fund and bond make investments more efficient
Коллекция по умолчанию
Коллекция по умолчанию
Создать новую

A close-up of a D pie chart with metallic textures, displaying financial performance analysis, with key figures and data points highlighted.
Коллекция по умолчанию
Коллекция по умолчанию
Создать новую

A colorful paper pie chart showcases pastel hues on a minimalist background, creating an engaging visual representation of data and creativity.
Коллекция по умолчанию
Коллекция по умолчанию
Создать новую

A vibrant pie chart displayed on a wooden surface, showcasing various colors divided into sections. Perfect for visualizing data in reports or presentations.
Коллекция по умолчанию
Коллекция по умолчанию
Создать новую
Picture of business graphics diagrama isolated over grey table background.
Коллекция по умолчанию
Коллекция по умолчанию
Создать новую

Colorful pie chart with vibrant segments displayed on a table, ideal for showcasing data analysis and business presentations in a creative and engaging manner.
Коллекция по умолчанию
Коллекция по умолчанию
Создать новую

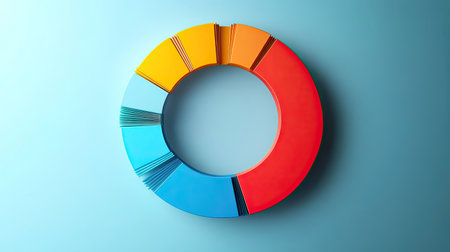
A modern, segmented donut chart with gradient colors on a smooth background, showcasing business sector analysis visually
Коллекция по умолчанию
Коллекция по умолчанию
Создать новую

A colorful financial pie chart showing market shares, with labeled sections representing stocks, bonds, and investments, displayed on a white background with clean lines.
Коллекция по умолчанию
Коллекция по умолчанию
Создать новую

A colorful financial pie chart showing market shares, with labeled sections representing stocks, bonds, and investments, displayed on a white background with clean lines.
Коллекция по умолчанию
Коллекция по умолчанию
Создать новую

The desktop of an astrologer. The magical mysterious atmosphere of the working environment of the predictor of the future. Printouts of astrological charts and tables scattered across the table.
Коллекция по умолчанию
Коллекция по умолчанию
Создать новую

A close-up of a pie chart illustrating market share distribution, with percentages highlighted for each segment.
Коллекция по умолчанию
Коллекция по умолчанию
Создать новую

A vibrant pie chart model featuring colorful segments on a glass table. Ideal for educational, business, and creative presentations to illustrate concepts effectively.
Коллекция по умолчанию
Коллекция по умолчанию
Создать новую
This vibrant circular data visualization presents an abstract layout of information with colorful patterns, perfect for projects emphasizing creativity and analysis.
Коллекция по умолчанию
Коллекция по умолчанию
Создать новую

A modern abstract circle design with vibrant orange, blue, and red sections. The minimalistic composition features light and shadow interplay, perfect for creative projects.
Коллекция по умолчанию
Коллекция по умолчанию
Создать новую
Vibrant and Colorful Circular Segments Creating a Dynamic Rainbow Palette on a Neutral Background
Коллекция по умолчанию
Коллекция по умолчанию
Создать новую

A large group of people standing in a circle. Generative AI image.
Коллекция по умолчанию
Коллекция по умолчанию
Создать новую
An elegant and modern pie chart showcasing a spectrum of blue and green shades. Perfect for business presentations or data analysis, this graphic represents clear statistical insights.
Коллекция по умолчанию
Коллекция по умолчанию
Создать новую
A colorful pie chart representation on a minimalist backdrop, ideal for data analysis, presentations, and business visuals, showcasing insights and metrics.
Коллекция по умолчанию
Коллекция по умолчанию
Создать новую

A macro shot of a pie chart in a presentation slide, capturing the distinct slices and their labels with a professional backdrop.
Коллекция по умолчанию
Коллекция по умолчанию
Создать новую

Colorful pie chart on wooden table, representing data visualization and analysis..
Коллекция по умолчанию
Коллекция по умолчанию
Создать новую

A visually appealing pie chart made of pastel colors against a soft blue background, perfect for educational materials, presentations, and creative projects.
Коллекция по умолчанию
Коллекция по умолчанию
Создать новую
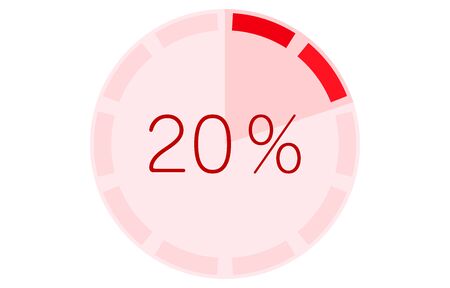
Graph with memory gauge, red
Коллекция по умолчанию
Коллекция по умолчанию
Создать новую

A pie chart diagram on a whiteboard during a team meeting, with markers and eraser nearby.
Коллекция по умолчанию
Коллекция по умолчанию
Создать новую

A detailed shot of a printed pie chart on a desk, with vibrant segments representing different data categories and a calculator beside it.
Коллекция по умолчанию
Коллекция по умолчанию
Создать новую

Small team working together with business reports
Коллекция по умолчанию
Коллекция по умолчанию
Создать новую

A detailed shot of a D pie chart with segmented sections and labels, displaying data in a visually engaging and three-dimensional format.
Коллекция по умолчанию
Коллекция по умолчанию
Создать новую

Explore a stunning digital visualization that features a colorful circular graph, showcasing data analysis through vibrant colors and innovative design, perfect for technology themes.
Коллекция по умолчанию
Коллекция по умолчанию
Создать новую

A creative pie chart with textured segments showing sales data, each slice representing a different product line, set against a rustic wooden table background.
Коллекция по умолчанию
Коллекция по умолчанию
Создать новую

A vibrant pie chart displayed on a report demonstrates clear data analysis. Ideal for business presentations and financial insights in a professional setting.
Коллекция по умолчанию
Коллекция по умолчанию
Создать новую

A vibrant pie chart on a light surface, perfect for business presentations, data analysis, or creative projects, showcasing colorful segments for visual impact.
Коллекция по умолчанию
Коллекция по умолчанию
Создать новую
A vibrant pie chart showcasing colorful segments against a minimalistic white background, ideal for illustrating data analysis and infographics in various professional settings.
Коллекция по умолчанию
Коллекция по умолчанию
Создать новую

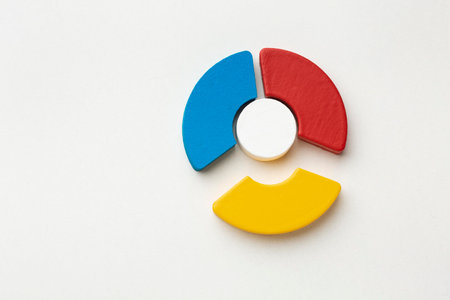
A vibrant pie chart composed of four sections in blue, red, yellow, and orange, set against a soft yellow background, ideal for marketing and educational materials.
Коллекция по умолчанию
Коллекция по умолчанию
Создать новую

Conceptual image of environmental conservation with different icons over wooden table
Коллекция по умолчанию
Коллекция по умолчанию
Создать новую

Colorful paper figures arranged in a circular formation symbolize diversity and unity. This creative design represents teamwork, collaboration, and community spirit.
Коллекция по умолчанию
Коллекция по умолчанию
Создать новую
Colorful pie chart with multiple segments
Коллекция по умолчанию
Коллекция по умолчанию
Создать новую

A close-up of a colorful pie chart on a computer screen, showcasing data distribution and percentages in a clear and engaging way.
Коллекция по умолчанию
Коллекция по умолчанию
Создать новую

High Angle View Of Businessperson's Hand Taking Piece With Money From Pie Chart
Коллекция по умолчанию
Коллекция по умолчанию
Создать новую
Vibrant paper segments arranged on a dark surface showcase creativity and modern design, ideal for business and educational presentations or artistic projects.
Коллекция по умолчанию
Коллекция по умолчанию
Создать новую

A simple, clear pie chart illustrating household financial planning, with different categories for savings, bills, and leisure, presented on a clean white surface.
Коллекция по умолчанию
Коллекция по умолчанию
Создать новую

A high-resolution image of a rotating 3D pie chart, highlighting financial performance metrics with clear, labeled sections and a neutral backdrop.
Коллекция по умолчанию
Коллекция по умолчанию
Создать новую

The desktop of an astrologer. The magical mysterious atmosphere of the working environment of the predictor of the future. Printouts of astrological charts and tables scattered across the table.
Коллекция по умолчанию
Коллекция по умолчанию
Создать новую
Colorful 3D pie chart on a pastel green background representing business analytics, data visualization, market share, and financial growth.
Коллекция по умолчанию
Коллекция по умолчанию
Создать новую

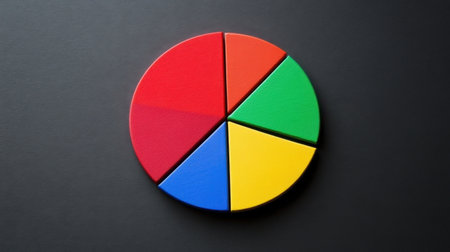
A minimalist pie chart infographic on a white background with segmented sections in bold colors, representing market share data.
Коллекция по умолчанию
Коллекция по умолчанию
Создать новую

A colorful pie chart divided into three segments, resting on a mint green background, symbolizing data representation and analysis.
Коллекция по умолчанию
Коллекция по умолчанию
Создать новую

A vibrant wooden pie chart with sections in blue, orange, and green rests on a colorful, abstract art surface, showcasing concepts of data representation and analysis.
Коллекция по умолчанию
Коллекция по умолчанию
Создать новую

Charts, graphs, and documents arranged in a circular layout highlight data organization and presentation in a minimal space with a grid background
Коллекция по умолчанию
Коллекция по умолчанию
Создать новую

This colorful pie chart illustration features segments in various hues on a soft blue background, perfect for use in business, marketing, or creative presentations.
Коллекция по умолчанию
Коллекция по умолчанию
Создать новую

A pie chart breakdown of sector allocations in an investment portfolio, highlighting diversification strategies.
Коллекция по умолчанию
Коллекция по умолчанию
Создать новую

Close-up of colorful pie chart segments resting on a wooden surface. This image illustrates data representation and visual analysis concepts for various applications.
Коллекция по умолчанию
Коллекция по умолчанию
Создать новую
A minimalistic pie chart with pastel-colored slices representing different budget categories, displayed on a light background with percentages clearly labeled for easy understanding.
Коллекция по умолчанию
Коллекция по умолчанию
Создать новую
This image features a vibrant segment wheel with distinct colors on a dark background, ideal for presentations, reports, and creative projects in design.
Коллекция по умолчанию
Коллекция по умолчанию
Создать новую

Colourful pie chart business diagram over blue background, financial growth, statistics or investment graph concept, 3D illustration
Коллекция по умолчанию
Коллекция по умолчанию
Создать новую

Graph of market share with black pen in business concept
Коллекция по умолчанию
Коллекция по умолчанию
Создать новую
Businessperson's Hand Placing Last Green Piece With Human Figures Into Pie Chart
Коллекция по умолчанию
Коллекция по умолчанию
Создать новую

A pie chart with vibrant colors and business growth indicators
Коллекция по умолчанию
Коллекция по умолчанию
Создать новую

Colorful cycle diagram. Business concept. Red, yellow, pink and blue cycle diagram on bright blue background with copy space.
Коллекция по умолчанию
Коллекция по умолчанию
Создать новую

A vibrant doughnut with a variety of colors placed on top of a black surface, A doughnut chart comparing high performing and low performing investments, AI Generated
Коллекция по умолчанию
Коллекция по умолчанию
Создать новую

A colorful pie chart with distinct segments in gradient colors, arranged on a white background with soft shadows for a clean financial analysis look
Коллекция по умолчанию
Коллекция по умолчанию
Создать новую

A vibrant pie chart sits on a wooden table in a bright, modern interior. This image captures the essence of creativity and analytical thinking in a cozy workspace setting.
Коллекция по умолчанию
Коллекция по умолчанию
Создать новую
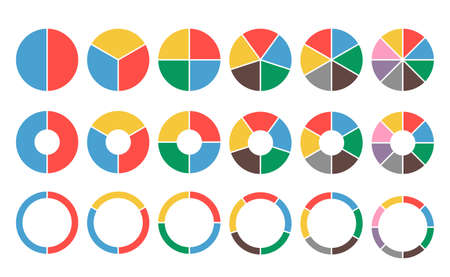
Large set of colored pie charts. 2,3,4,5,6,8 sections. Flat icons
Коллекция по умолчанию
Коллекция по умолчанию
Создать новую

Empty auditorium prepared for business presentation at international summit with diverse mixed age audience, networking event in conference hall. Business development and training.
Коллекция по умолчанию
Коллекция по умолчанию
Создать новую
Colorful pie chart on a white background. 3d render.
Коллекция по умолчанию
Коллекция по умолчанию
Создать новую
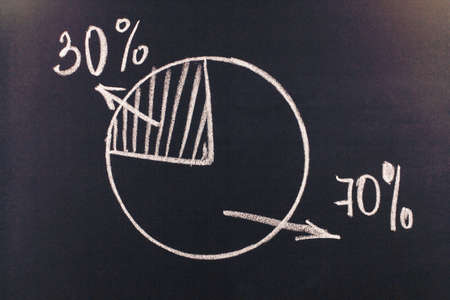
drawing with chalk on a blackboard
Коллекция по умолчанию
Коллекция по умолчанию
Создать новую
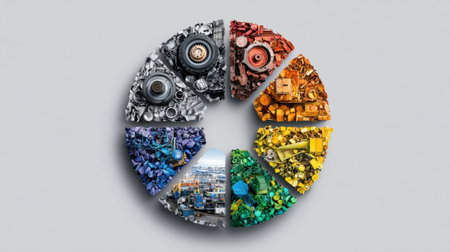
This vibrant wheel showcases a variety of industrial items, highlighting themes of recycling and sustainability in modern manufacturing environments.
Коллекция по умолчанию
Коллекция по умолчанию
Создать новую

A close-up of a colorful business pie chart with segmented sections, showcasing data distribution and a clean, professional design.
Коллекция по умолчанию
Коллекция по умолчанию
Создать новую
An abstract and modern infographic dial in shades of purple, representing the measurement of unconventional values or data points.
Коллекция по умолчанию
Коллекция по умолчанию
Создать новую
Bold circular shapes in purple and orange contrast against a simple background, showing contemporary design through abstract art elements.
Коллекция по умолчанию
Коллекция по умолчанию
Создать новую

business hand writing business cycle concept
Коллекция по умолчанию
Коллекция по умолчанию
Создать новую
A vibrant detailed 3D pie chart against a soft pastel backdrop
Коллекция по умолчанию
Коллекция по умолчанию
Создать новую
This vibrant pie chart features multiple colorful segments, ideal for presentations, analysis, and visual representation of statistics or data trends in various fields.
Коллекция по умолчанию
Коллекция по умолчанию
Создать новую
Colorful pie chart model showcases different segments on a dark background, ideal for educational and business presentations to visualize data clearly.
Коллекция по умолчанию
Коллекция по умолчанию
Создать новую
Color swatches palette on white background. Top view. Vector illustration.
Коллекция по умолчанию
Коллекция по умолчанию
Создать новую
A rotating D pie chart with colorful, layered sections representing data, with numbers and labels floating beside each slice for clarity.
Коллекция по умолчанию
Коллекция по умолчанию
Создать новую

Colorful pie chart on a wooden table with sunlight and shadows, abstract concept
Коллекция по умолчанию
Коллекция по умолчанию
Создать новую

layers pie chart blue
Коллекция по умолчанию
Коллекция по умолчанию
Создать новую

Pie Chart with Vibrant Sections on a Checkered Background.
Коллекция по умолчанию
Коллекция по умолчанию
Создать новую

Vibrant and colorful charts and graphs illustrating data analysis, showcasing insights for business and marketing strategies in a professional context.
Коллекция по умолчанию
Коллекция по умолчанию
Создать новую

3d pie chart showcasing business distribution with a striking depth of field
Коллекция по умолчанию
Коллекция по умолчанию
Создать новую

A vibrant pie chart composed of colorful segments set against a soft blue background, perfect for educational and business presentations, showcasing data visualization.
Коллекция по умолчанию
Коллекция по умолчанию
Создать новую
A minimalist pie chart infographic on a white background with segmented sections in bold colors, representing market share data.
Коллекция по умолчанию
Коллекция по умолчанию
Создать новую

Vibrant 3D pie chart with gradient of pink and orange colors, showcasing data visualization. chart is set against dark background, enhancing its modern and sleek appearance
Коллекция по умолчанию
Коллекция по умолчанию
Создать новую
Pie chart illustration. Flat design style with stripes
Коллекция по умолчанию
Коллекция по умолчанию
Создать новую

A dynamic D pie chart emerging from a digital interface, representing quarterly earnings distribution, surrounded by floating icons symbolizing various financial metrics, highlighting innovation in finance.
Коллекция по умолчанию
Коллекция по умолчанию
Создать новую

A colorful D pie chart with slices that appear to pop out, set against a contrasting background, showcasing data segments in a visually engaging way.
Коллекция по умолчанию
Коллекция по умолчанию
Создать новую
Legion-Media
Создайте свои проекты на основе качественных стоковых фотографий и видео.


Copyright © Legion-Media.