
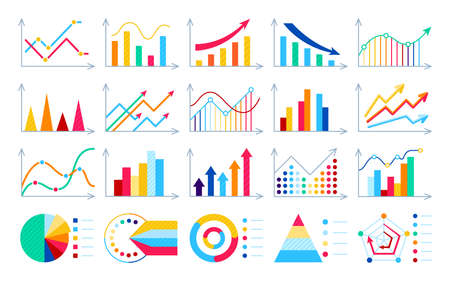
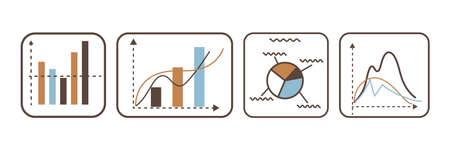
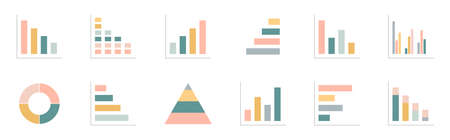
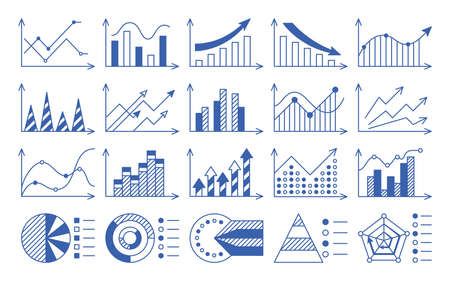
Business Graph Solid Icon Set
Коллекция по умолчанию
Коллекция по умолчанию
Создать новую
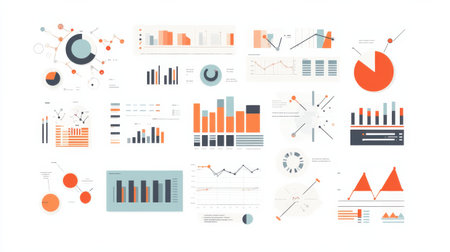
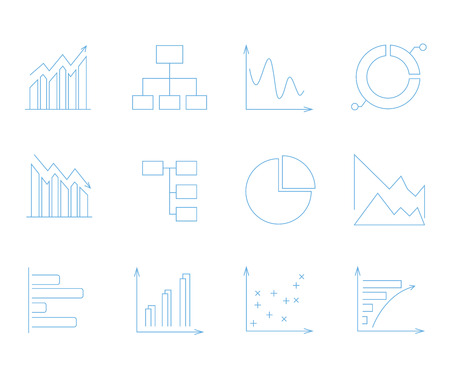
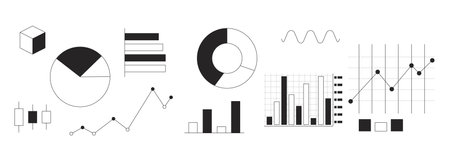
Chart, graph and diagram icon set. Business report, statistics, data analysis, finance market design elements. Ui, app and website graphic. Vector illustration.
Коллекция по умолчанию
Коллекция по умолчанию
Создать новую
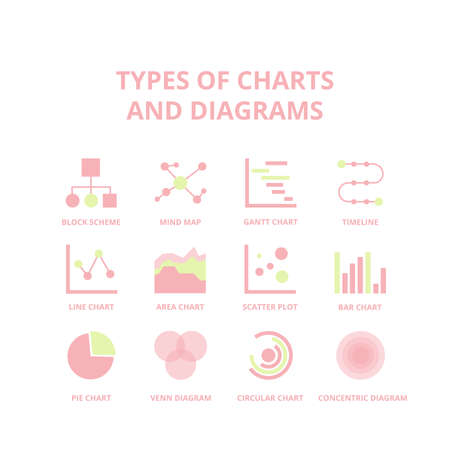
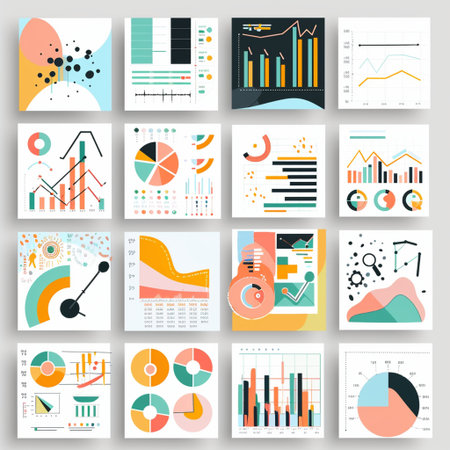
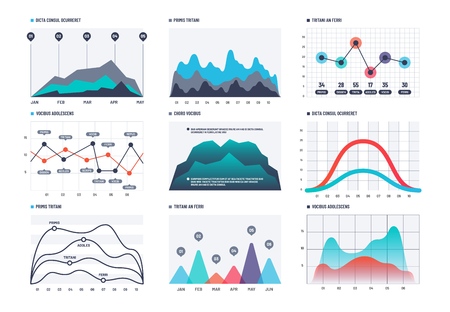
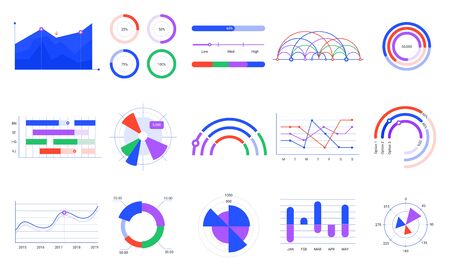
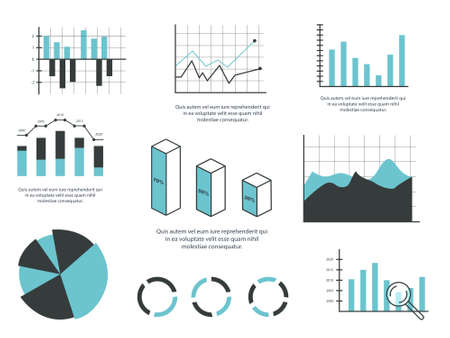
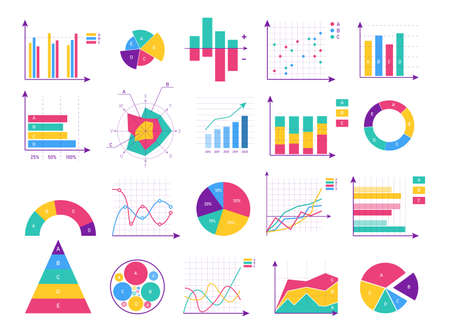
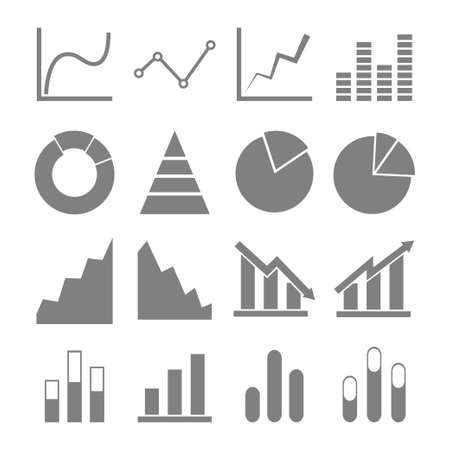
Types of various charts and diagrams. The set of schemes and graphs. Statistical data and financial information visualization. Vector illustration for business presentation, report, infographics
Коллекция по умолчанию
Коллекция по умолчанию
Создать новую
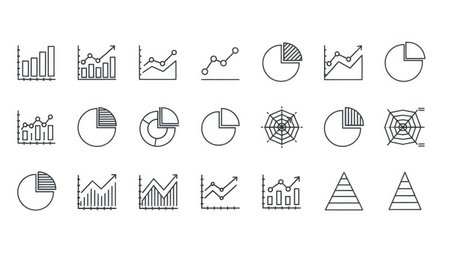
Set Of Graphs, Diagrams And Statistics Icons. Premium Quality Symbol Collection. Icons Can Be Used For Web, App And UI Design.
Коллекция по умолчанию
Коллекция по умолчанию
Создать новую
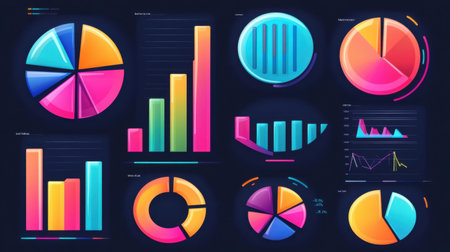
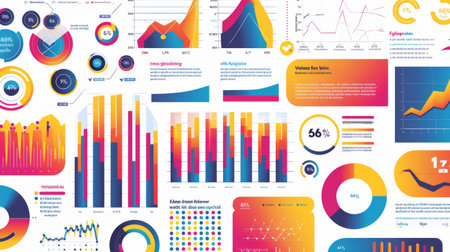
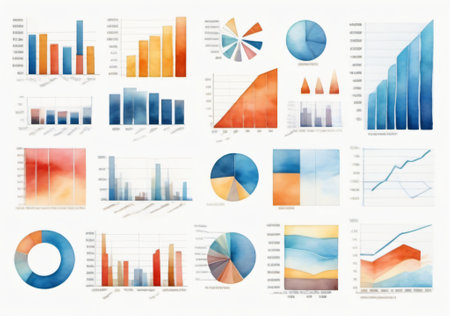
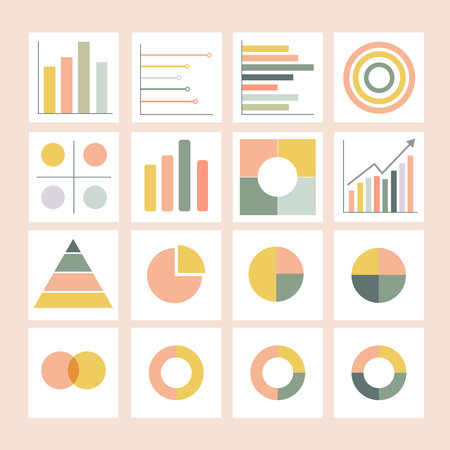
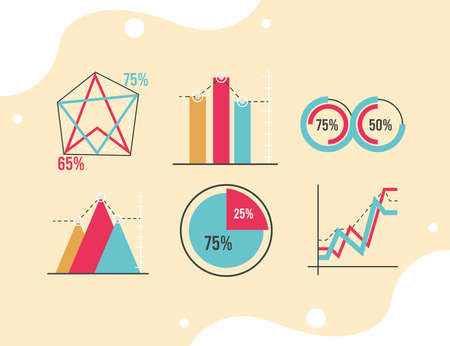
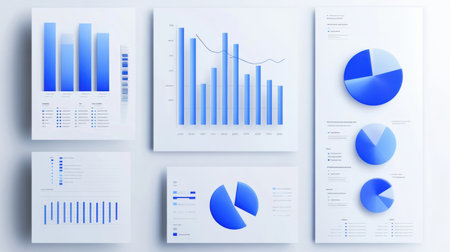
Vibrant data visualizations featuring a variety of charts and graphs. Ideal for business presentations, reports, and analytical projects in a modern design.
Коллекция по умолчанию
Коллекция по умолчанию
Создать новую
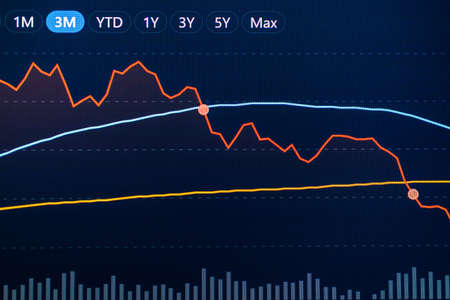
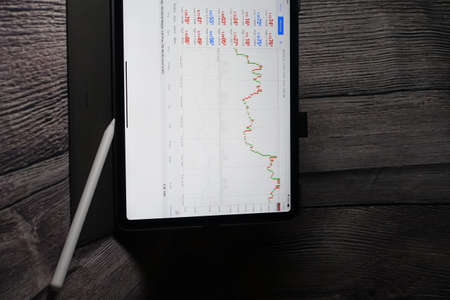
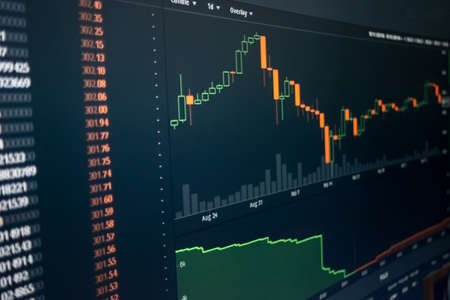
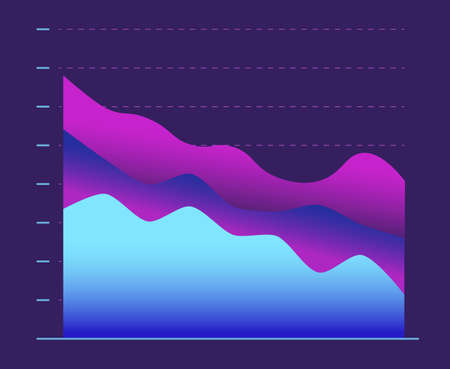
Data financial instruments chart, downtrend stock market analysis report
Коллекция по умолчанию
Коллекция по умолчанию
Создать новую

Data visualization showing trends and user interaction metrics over time in digital format
Коллекция по умолчанию
Коллекция по умолчанию
Создать новую
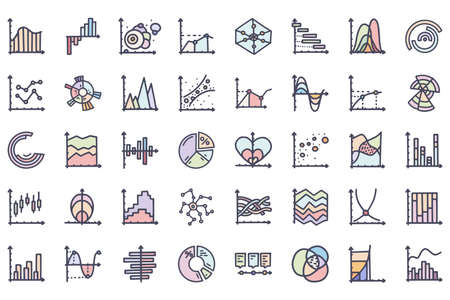
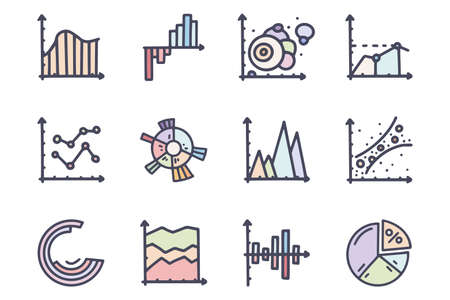
Chart and diagram color vector doodle simple icon set
Коллекция по умолчанию
Коллекция по умолчанию
Создать новую
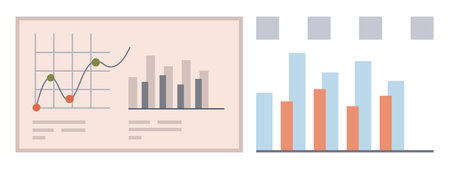
Various data visuals are displayed, including bar graphs, line charts, and pie charts showing trends and statistics across different categories and metrics.
Коллекция по умолчанию
Коллекция по умолчанию
Создать новую
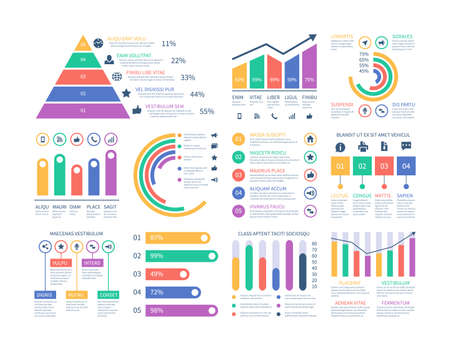
Infographic diagram graphic plan colorful flat set. Financial analysis work data rating success defeat. Business process presentation marketing strategy arrow investing growth result fall isolated
Коллекция по умолчанию
Коллекция по умолчанию
Создать новую
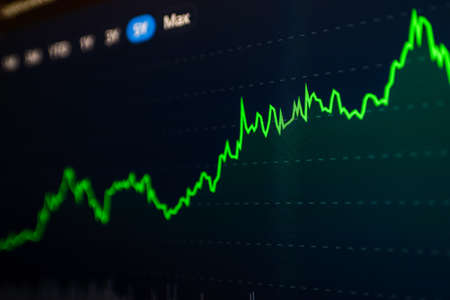
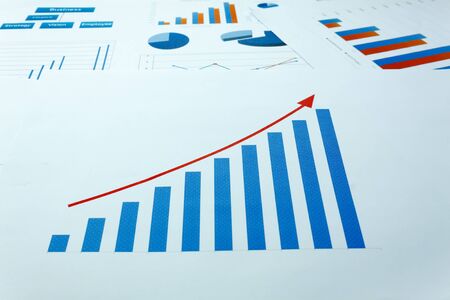
Grow Stock market trading graph in graphic concept.financial investment or economic trends business design. Abstract finance background.Low angle shot.
Коллекция по умолчанию
Коллекция по умолчанию
Создать новую
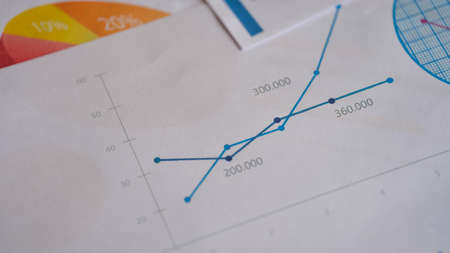
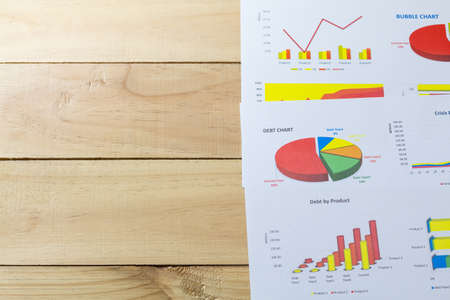
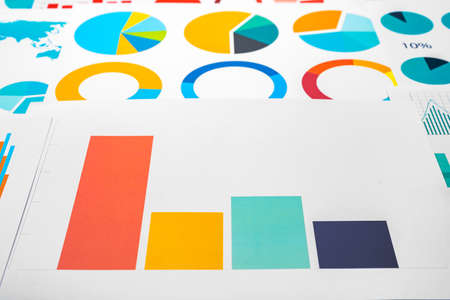
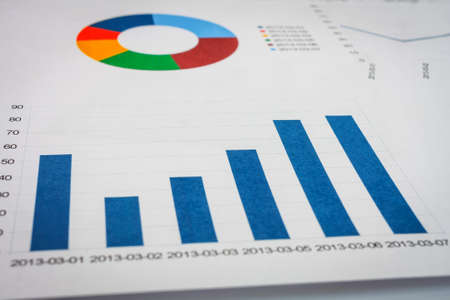
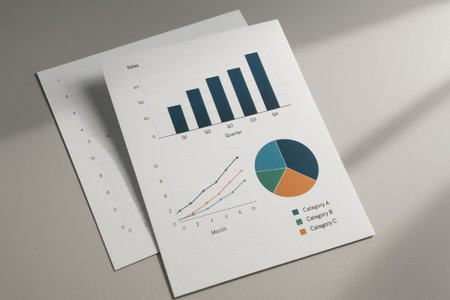
Documents with colourful charts, graphs and diagrams
Коллекция по умолчанию
Коллекция по умолчанию
Создать новую
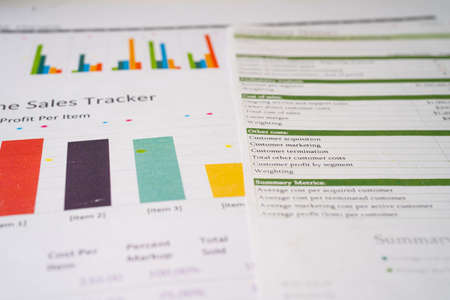
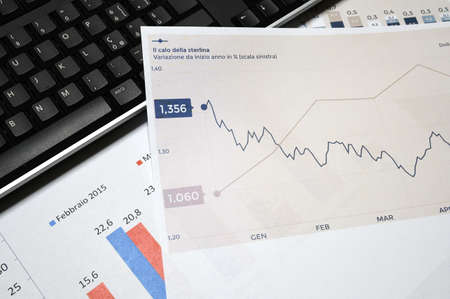
Charts Graphs spreadsheet paper. Financial development, Banking Account, Statistics, Investment Analytic research data economy, Stock exchange Business office company meeting concept.
Коллекция по умолчанию
Коллекция по умолчанию
Создать новую

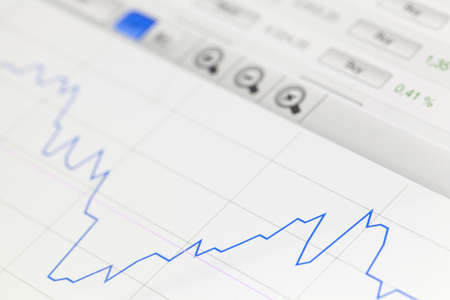
chart or graph paper. Financial, account, statistics and business data concept.
Коллекция по умолчанию
Коллекция по умолчанию
Создать новую

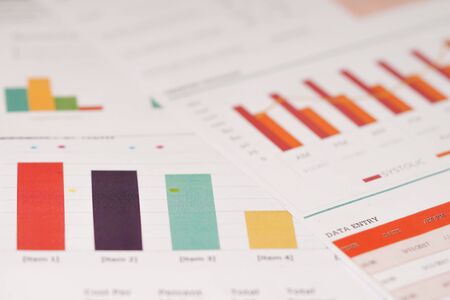
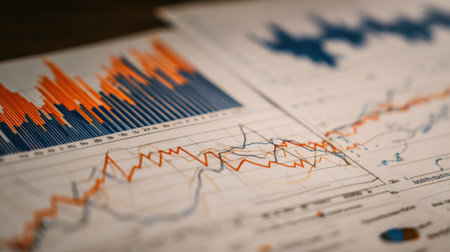
reports and histograms on paper on the table, analytics and statistics on paper, business analytics
Коллекция по умолчанию
Коллекция по умолчанию
Создать новую
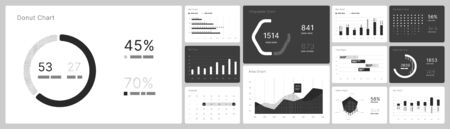
Infographic elements in white and black colors. Use in presentation templates, flyer, leaflet and corporate report. UI and UX Kit with big data visualization.
Коллекция по умолчанию
Коллекция по умолчанию
Создать новую
A vibrant infographic with various graphs and data points, representing statistical information clearly.
Коллекция по умолчанию
Коллекция по умолчанию
Создать новую
Stock Market Chart on Blue Background. share drop down and stock up
Коллекция по умолчанию
Коллекция по умолчанию
Создать новую

image is a graph of financial development on a computer monitor.
Коллекция по умолчанию
Коллекция по умолчанию
Создать новую
An office worker shows his colleagues a presentation with a company development graph at night on the company's computer
Коллекция по умолчанию
Коллекция по умолчанию
Создать новую
Stock Market Loss Trading Chart Investment Analysis Business Index Chart Finance Board Chart
Коллекция по умолчанию
Коллекция по умолчанию
Создать новую

A close-up of a digital dashboard with rising investments, offering space for adding content about investment performance, growth, or risk management
Коллекция по умолчанию
Коллекция по умолчанию
Создать новую
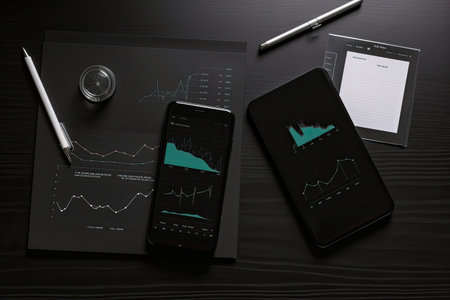
Smartphone and Tablet pc with financial charts and graphs on office desk, business concept
Коллекция по умолчанию
Коллекция по умолчанию
Создать новую
Close up of business graph analysis document
Коллекция по умолчанию
Коллекция по умолчанию
Создать новую
Financial graphic chart
Коллекция по умолчанию
Коллекция по умолчанию
Создать новую
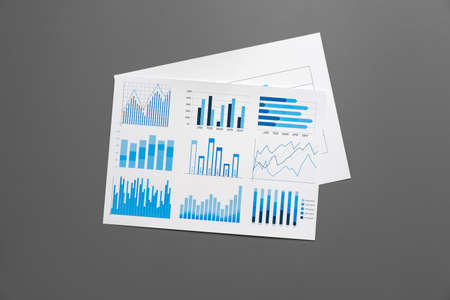
Financial paper with charts and diagrams on gray table
Коллекция по умолчанию
Коллекция по умолчанию
Создать новую
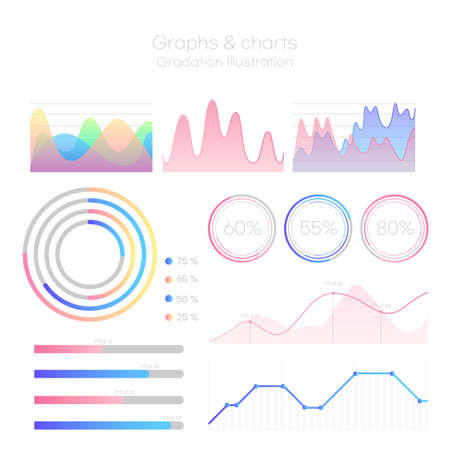
infographics graph, chart, diagram set in gradation colors
Коллекция по умолчанию
Коллекция по умолчанию
Создать новую

Business graph analysis documents on gray background
Коллекция по умолчанию
Коллекция по умолчанию
Создать новую
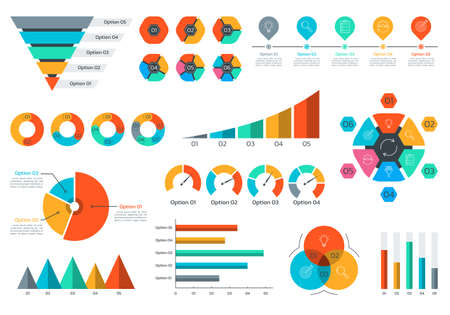
Chart and graph set. Business data infographic elements with circle diagram, pie chart, funnel, timeline infographics. Vector illustration.
Коллекция по умолчанию
Коллекция по умолчанию
Создать новую

responsibility and cooperation of the working team Business cash, business concept
Коллекция по умолчанию
Коллекция по умолчанию
Создать новую
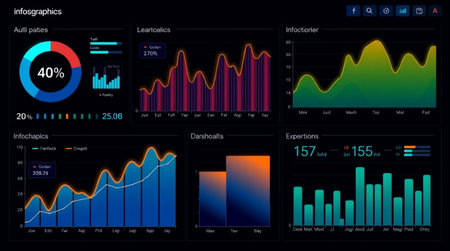
Futuristic infographics design elements for business presentations, annual reports and web design.
Коллекция по умолчанию
Коллекция по умолчанию
Создать новую

set of charts and graphs for reports and statistics
Коллекция по умолчанию
Коллекция по умолчанию
Создать новую

image of the financial graph on a computer monitor.
Коллекция по умолчанию
Коллекция по умолчанию
Создать новую

This image features abstract data visualization elements, including colorful graphs and charts, ideal for business analytics and market research presentations.
Коллекция по умолчанию
Коллекция по умолчанию
Создать новую
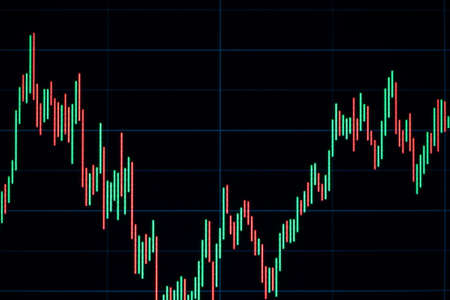
A stock market graph on a black background.
Коллекция по умолчанию
Коллекция по умолчанию
Создать новую
securities price chart on the monitor screen
Коллекция по умолчанию
Коллекция по умолчанию
Создать новую
data analysis icons, graph and chart icons
Коллекция по умолчанию
Коллекция по умолчанию
Создать новую

Analysis of data from graphs. select focus.
Коллекция по умолчанию
Коллекция по умолчанию
Создать новую
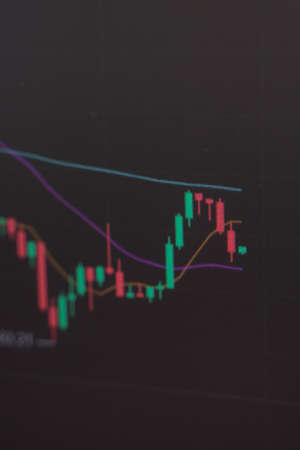
Change the stock market chart. The fall in the value of cryptocurrencies. Brokerage data
Коллекция по умолчанию
Коллекция по умолчанию
Создать новую
Charts and graphs vector linear illustrations set. Finance market growth, decline rates in schemes. Business data visualization, statistical analysis infographics diagrams isolated design elements
Коллекция по умолчанию
Коллекция по умолчанию
Создать новую
Set of Infographic Elements for Your Design. Vector Illustration.
Коллекция по умолчанию
Коллекция по умолчанию
Создать новую
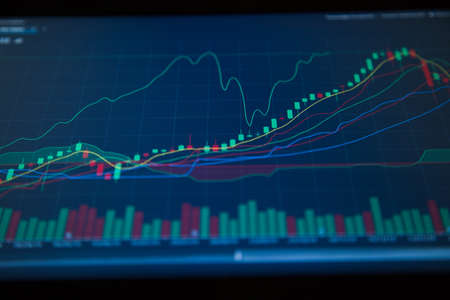
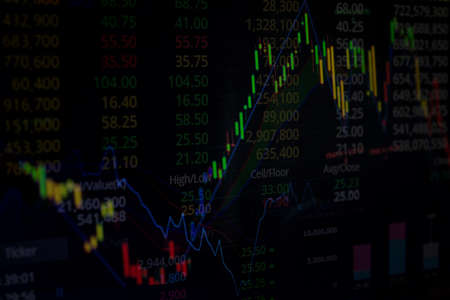
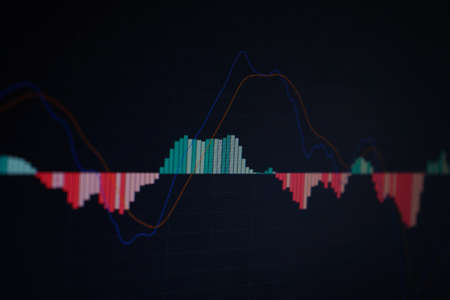
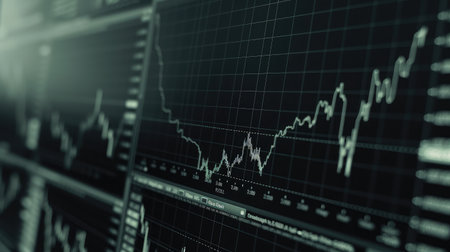
Economic graphic. Financial chart, stock analysis data for business background in digital screen. Graphics growth forex finance market. Stock analyzing. Price chart bars
Коллекция по умолчанию
Коллекция по умолчанию
Создать новую
Bitcoin. Change the price on the display. Brokerage information, display of the price of the electronic means of payment
Коллекция по умолчанию
Коллекция по умолчанию
Создать новую
Charts Graphs paper. Financial development, Banking Account, Statistics, Investment Analytic research data economy, Stock exchange Business office company meeting concept.
Коллекция по умолчанию
Коллекция по умолчанию
Создать новую

A statistical report with a diagram lies on the table
Коллекция по умолчанию
Коллекция по умолчанию
Создать новую

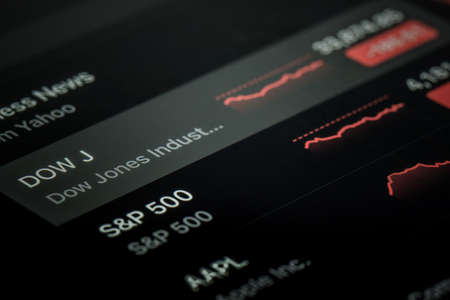
Shallow depth of field (selective focus) with details of a chart showing the stock market crash from March 2020 due to the Covid-19 pandemic on a computer screen (S&P500 index)
Коллекция по умолчанию
Коллекция по умолчанию
Создать новую
Set of graphs and charts. Vector illustration. Elements for design.
Коллекция по умолчанию
Коллекция по умолчанию
Создать новую
Data visualization charts black and white 2D line objects set. Piechart, bar graphs, scatter plots. Analysis diagrams isolated clip arts vector outline items collection. Monochrome spot illustrations
Коллекция по умолчанию
Коллекция по умолчанию
Создать новую

Stock market graph on screen. Ticker on monitor screen. Investing, Finance and Economic concept. Shallow depth of field.
Коллекция по умолчанию
Коллекция по умолчанию
Создать новую
Infographic chart. Statistics bar graphs, economic diagrams and charts. Demographic infographics vector elements. Infographic data, graph diagram template for presentation illustration
Коллекция по умолчанию
Коллекция по умолчанию
Создать новую
Charts color vector doodle simple icon set
Коллекция по умолчанию
Коллекция по умолчанию
Создать новую

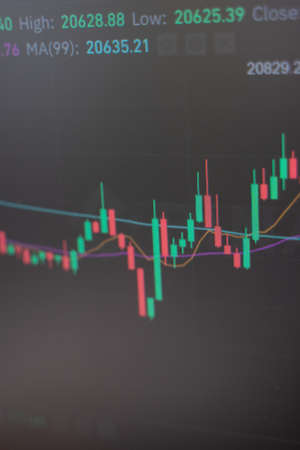
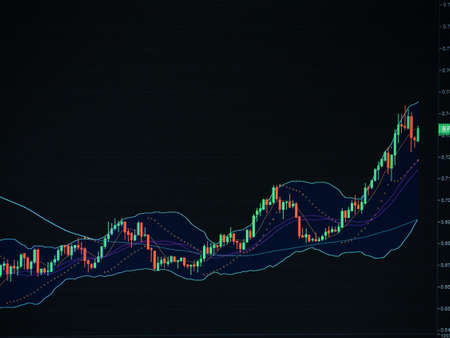
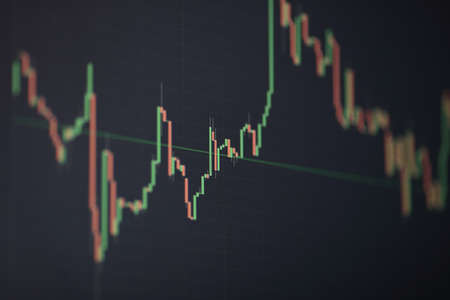
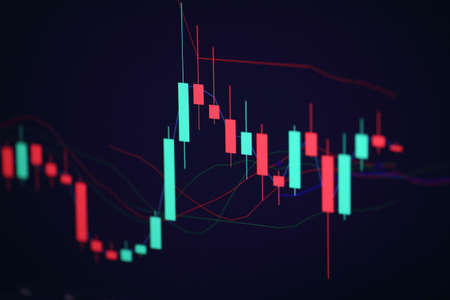
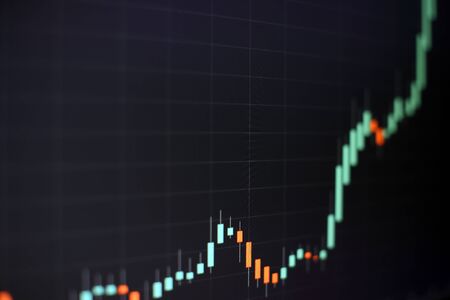
Shallow depth of field (selective focus) with details of a candlestick chart on a computer screen.
Коллекция по умолчанию
Коллекция по умолчанию
Создать новую

Background with financial charts. Neon colors. The concept of analytics, business or trading on the financial exchange. Vector.
Коллекция по умолчанию
Коллекция по умолчанию
Создать новую
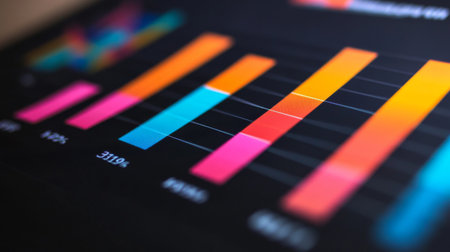
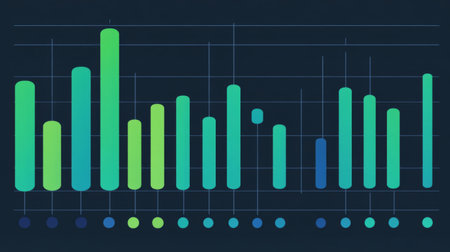
Vibrant bar graph displayed on a digital screen, showcasing data insights and trends for business analysis. Ideal for presentations and reports.
Коллекция по умолчанию
Коллекция по умолчанию
Создать новую
Collection of charts and graphs isolated on white background
Коллекция по умолчанию
Коллекция по умолчанию
Создать новую

Business statistics and Analytics value . Abstract glowing forex chart interface background. Investment, trade, stock, finance and analysis concept.
Коллекция по умолчанию
Коллекция по умолчанию
Создать новую
Business or Financial Reference: Displaying stock market data, stock exchange or chart on a monitor, stock market chart, stock exchange or chart. stock market investment trading chart.
Коллекция по умолчанию
Коллекция по умолчанию
Создать новую
business background grown up concept the business chart document background.
Коллекция по умолчанию
Коллекция по умолчанию
Создать новую
Icon of some chart
Коллекция по умолчанию
Коллекция по умолчанию
Создать новую

Close-up of a financial graph on a computer screen, showcasing upward and downward trends with detailed line and bar charts.
Коллекция по умолчанию
Коллекция по умолчанию
Создать новую
Graph charts. Colorful diagrams, statistics dashboard chart and infographic elements vector set. Stock market graph, financial audit infochart isolated on white background. Sales rate analysing
Коллекция по умолчанию
Коллекция по умолчанию
Создать новую

Chart 6 icons vector eps10
Коллекция по умолчанию
Коллекция по умолчанию
Создать новую
Bar graph and line graph presenting financial or business data trends on a grid layout. Ideal for analytics, statistics, financial reporting, market research, education, presentations, simple flat
Коллекция по умолчанию
Коллекция по умолчанию
Создать новую
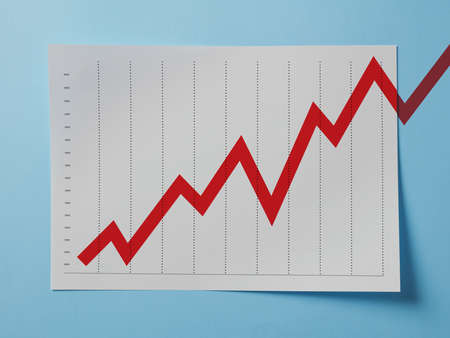
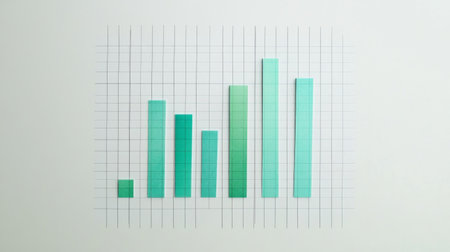
Growing chart on A4 page on blue background
Коллекция по умолчанию
Коллекция по умолчанию
Создать новую
Business infographics. Vector set of business elements such as marketing charts, graphs. Inforgaphics data template.
Коллекция по умолчанию
Коллекция по умолчанию
Создать новую
Medium shot of a closeup on charts and graphs illustrating loan interest rate fluctuations over time
Коллекция по умолчанию
Коллекция по умолчанию
Создать новую
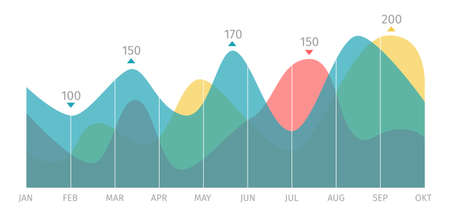
Line graph template. Vector illustration for workflow layout, diagram, number options, web design. Vector business infographic template for report, presentation in trendy pastel colors
Коллекция по умолчанию
Коллекция по умолчанию
Создать новую
Stock Market Loss Trading Chart Investment Analysis Business Index Chart Finance Board Chart
Коллекция по умолчанию
Коллекция по умолчанию
Создать новую
Business documents at workplace, financial report, close up
Коллекция по умолчанию
Коллекция по умолчанию
Создать новую
infographics collection business graph, chart graph ecomomic finance elements.
Коллекция по умолчанию
Коллекция по умолчанию
Создать новую

Work table of a businessman with papers, graphs and glasses. Business presentation template with papers, folder and a chair in the background. High quality photo
Коллекция по умолчанию
Коллекция по умолчанию
Создать новую
Business Objects in the office on the table.
Коллекция по умолчанию
Коллекция по умолчанию
Создать новую
Presentation infographic. flowchart timeline process chart, organization workflow, number option diagrams, business step, percentage and statistic data visualization illustration. Isolated set
Коллекция по умолчанию
Коллекция по умолчанию
Создать новую
Stock market trading graph in graphic concept.financial investment or economic trends business design. Abstract finance background.Low angle shot.
Коллекция по умолчанию
Коллекция по умолчанию
Создать новую

Image of statistics and financial data processing over purple background. Global business, finances, computing and data processing concept digitally generated image.
Коллекция по умолчанию
Коллекция по умолчанию
Создать новую
Financial Business data market graph elements templates dot bar pie charts diagrams and graphs flat icons set isolated vector illustration
Коллекция по умолчанию
Коллекция по умолчанию
Создать новую
The business plan at the meeting and analyze financial numbers to view the performance of the company.
Коллекция по умолчанию
Коллекция по умолчанию
Создать новую
Set of business finance graph icon. Variety flat symbol vector. White element on grey background with shadow.
Коллекция по умолчанию
Коллекция по умолчанию
Создать новую
Trading forex with METATRADER 4 on Apple iPad Pro 11 inch. iPad Pro is the most user friendly which good for people on the go.
Коллекция по умолчанию
Коллекция по умолчанию
Создать новую
This vibrant data visualization features colorful bar graphs, representing various metrics and statistics, ideal for presentations and reports in business and technology.
Коллекция по умолчанию
Коллекция по умолчанию
Создать новую
six infographics statistics
Коллекция по умолчанию
Коллекция по умолчанию
Создать новую
Graph chart color icons set. Annual report presentation. Business data statistic. Financial bar sign. Pie chart diagram. Finance progress plan. Web interface. Infographic template. Vector illustration
Коллекция по умолчанию
Коллекция по умолчанию
Создать новую
Stockmarket diagram and grah on displayscreen
Коллекция по умолчанию
Коллекция по умолчанию
Создать новую
graph icon
Коллекция по умолчанию
Коллекция по умолчанию
Создать новую
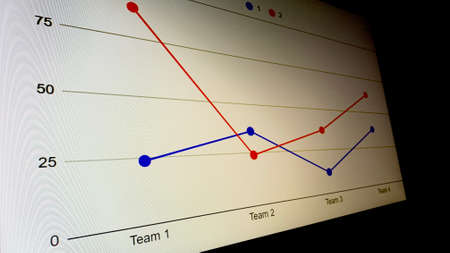
A clear visual presentation illustrates a before and after comparison of low sales performance and impressive exponential growth over time.
Коллекция по умолчанию
Коллекция по умолчанию
Создать новую

Brand awareness forecast and strategy plan icon
Коллекция по умолчанию
Коллекция по умолчанию
Создать новую
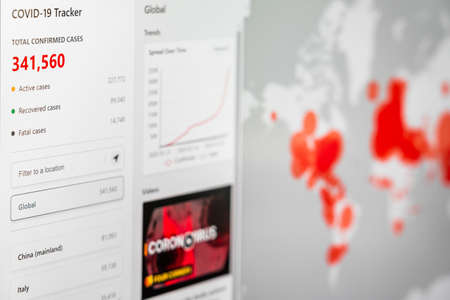
BUCHAREST, ROMANIA - MARCH 23, 2020: Coronavirus Total Cases Of The Pandemic Spreading All Around The Globe In March
Коллекция по умолчанию
Коллекция по умолчанию
Создать новую
Showing business and financial report. 3D rendering. Stock Photo
Коллекция по умолчанию
Коллекция по умолчанию
Создать новую

Business chart with line graph, bar chart and numbers on dark background, 3d rendering. Computer digital drawing.
Коллекция по умолчанию
Коллекция по умолчанию
Создать новую
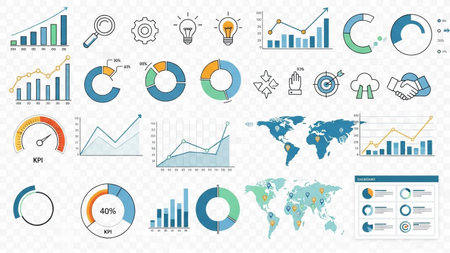
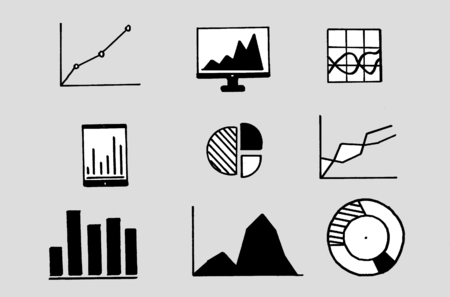
A comprehensive set of hand-drawn and digital icons, charts, graphs, and world maps representing business concepts and data analysis.
Коллекция по умолчанию
Коллекция по умолчанию
Создать новую
Sustainable portfolio management, long term wealth management with risk diversification concept.
Коллекция по умолчанию
Коллекция по умолчанию
Создать новую
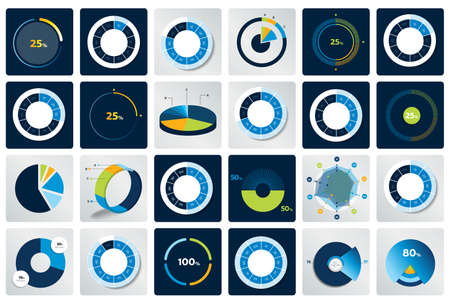
Big set of round, circle chart, graph. Simply color editable. Infographics elements.
Коллекция по умолчанию
Коллекция по умолчанию
Создать новую
A financial bar chart showing comparison of investment returns, with green bars rising sharply to symbolize growth, displayed against a white background with grid lines.
Коллекция по умолчанию
Коллекция по умолчанию
Создать новую
A high-resolution image of a stock market graph on a computer screen.
Коллекция по умолчанию
Коллекция по умолчанию
Создать новую
Analytics infographics elements. Data graphic, marketing chart diagram. Budget flat histogram. Statistic infographics elements. Illustration of visualization diagram, infographic statistic flowchart
Коллекция по умолчанию
Коллекция по умолчанию
Создать новую
Infographic diagram blue ballpoint pen glyph set. Object workflow presentation business personal team career growth. Finance stock concept success rating scale arrow stage growth fall isolated
Коллекция по умолчанию
Коллекция по умолчанию
Создать новую
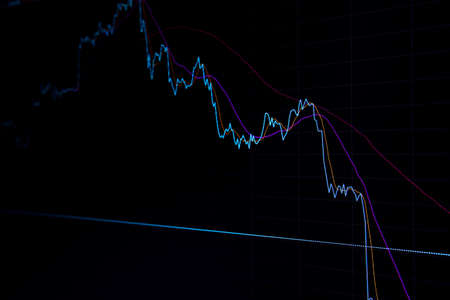
Abstract financial chart with three line go down. Modern futuristic
Коллекция по умолчанию
Коллекция по умолчанию
Создать новую

Shallow depth of field (selective focus) with details of a candlestick chart on a computer screen.
Коллекция по умолчанию
Коллекция по умолчанию
Создать новую
Economic graph with diagrams on the stock market, for business and financial concepts and reports.
Коллекция по умолчанию
Коллекция по умолчанию
Создать новую

Financial paper with charts and diagrams on gray table
Коллекция по умолчанию
Коллекция по умолчанию
Создать новую
Legion-Media
Создайте свои проекты на основе качественных стоковых фотографий и видео.


Copyright © Legion-Media.