

Business graph and chart on cityscape background. Financial and trade concept. Double exposure
Коллекция по умолчанию
Коллекция по умолчанию
Создать новую

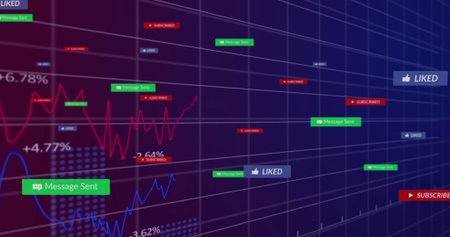
Trading business chart on dark colorful neon background. Financial stock market graph on technology abstract background. AI
Коллекция по умолчанию
Коллекция по умолчанию
Создать новую

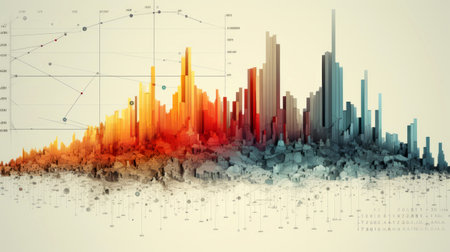
Financial Column Chart with Glowing Lines on a Dark Background, Data Analysis, Stock Market Concept
Коллекция по умолчанию
Коллекция по умолчанию
Создать новую

Image of light spots and diagrams over cityscape. Global business and digital interface concept digitally generated image.
Коллекция по умолчанию
Коллекция по умолчанию
Создать новую

Economic and financial charts and graphics. Generative AI
Коллекция по умолчанию
Коллекция по умолчанию
Создать новую

powerbi data analysis software
Коллекция по умолчанию
Коллекция по умолчанию
Создать новую

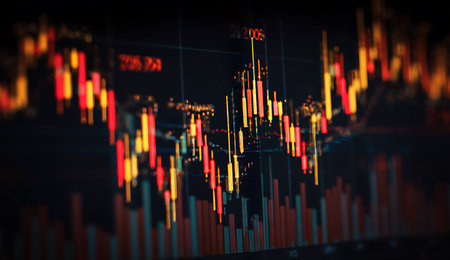
Business candle stick graph chart of stock market investment trading, Bullish point, Bearish point. trend of graph design. Gnerative AI
Коллекция по умолчанию
Коллекция по умолчанию
Создать новую

Market research and marketing analysis with Ai technology. customer surveys and statistics. analysts touch on pie charts and graphs, financial growth graph chart report, Business planning
Коллекция по умолчанию
Коллекция по умолчанию
Создать новую
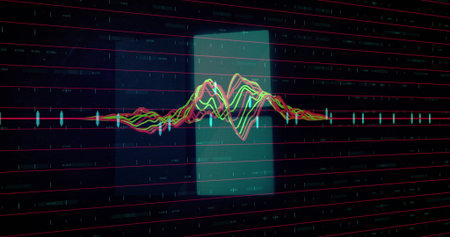
Displaying neon-colored waveform undulating around axis on dark screen, with turquoise rectangle. Futuristic, technology, digital, chart, data, electronic, vibrant
Коллекция по умолчанию
Коллекция по умолчанию
Создать новую

infographic graph chart data vector illustration eps10
Коллекция по умолчанию
Коллекция по умолчанию
Создать новую

Data graph, retro futuristic visualisation of diagrams and finance graphics, AI generative
Коллекция по умолчанию
Коллекция по умолчанию
Создать новую

3d render, abstract background with lines and waves, digital technology illustration
Коллекция по умолчанию
Коллекция по умолчанию
Создать новую

Businessman in suit drawing graphs on modern statistical media interface while standing on broken bridge with cityscape and sunlight on background. 3D rendering.
Коллекция по умолчанию
Коллекция по умолчанию
Создать новую

Multi exposure of stock market chart drawing and office interior background. Concept of financial analysis.
Коллекция по умолчанию
Коллекция по умолчанию
Создать новую

Stock market business and exchange financial growth graph. Growth up graph business financial investment or economic concept.
Коллекция по умолчанию
Коллекция по умолчанию
Создать новую

Goal business success strategy chart target. Business finance marketing and investment. Stock market graph with man pointing financial profit stock market development.
Коллекция по умолчанию
Коллекция по умолчанию
Создать новую

learn how to create photorealistic line graphs using software such as adobe illustrator, microsoft excel, or google sheets. simply input the data points for each year and use the software's graphing tools to create a line graph. adjust the size of the graph to 3840 x 2160 pixels to match your desired dimensions. ai generated
Коллекция по умолчанию
Коллекция по умолчанию
Создать новую

financial chart on the table, stock market data analysis, business concept
Коллекция по умолчанию
Коллекция по умолчанию
Создать новую

Displaying translucent bar chart with grid overlay over cloudy sky, featuring slider indicators. Graphs, data, analytics, interface, presentation, digital, abstract
Коллекция по умолчанию
Коллекция по умолчанию
Создать новую

Group of business women working on a financial data expenses document.
Коллекция по умолчанию
Коллекция по умолчанию
Создать новую

the document reviewer is comparing the information to match the meeting minutes to be presented to investor, businessman is working in finance, accountant, marketing, businesswoman
Коллекция по умолчанию
Коллекция по умолчанию
Создать новую

Financial data graph at stock exchange
Коллекция по умолчанию
Коллекция по умолчанию
Создать новую

Tablet, app, market.
Коллекция по умолчанию
Коллекция по умолчанию
Создать новую
3D bar graph showing complex data
Коллекция по умолчанию
Коллекция по умолчанию
Создать новую

change in the exchange rate, trading charts on the close-up lcd screen
Коллекция по умолчанию
Коллекция по умолчанию
Создать новую

art color graph illustration background
Коллекция по умолчанию
Коллекция по умолчанию
Создать новую

Portrait of business people sit conference room check annual results graph report loft office indoors
Коллекция по умолчанию
Коллекция по умолчанию
Создать новую

carbon dioxide emissions being visualized through the use of data visualization, created with generative ai
Коллекция по умолчанию
Коллекция по умолчанию
Создать новую

Image of data processing over colorful grid. Global sports fitness connections and technology concept digitally generated image.
Коллекция по умолчанию
Коллекция по умолчанию
Создать новую
Showing dashboard on screen with red and blue line graphs, social labels and percentages. Analytics, data, technology, interface, visualization, digital, innovation
Коллекция по умолчанию
Коллекция по умолчанию
Создать новую

A colorful chart showing a steady upward trend of scalability in company and businesses, representing the idea of growth and financial success in business. Generative AI
Коллекция по умолчанию
Коллекция по умолчанию
Создать новую

chplot data points
Коллекция по умолчанию
Коллекция по умолчанию
Создать новую

3d isometric business graph on the tablet. Vector illustration.
Коллекция по умолчанию
Коллекция по умолчанию
Создать новую

business people meet with design ideas business planning Picture of two young businessmen holding pens and graph papers at a meeting discussing charts and graphs showing successful
Коллекция по умолчанию
Коллекция по умолчанию
Создать новую

Businesswomen analyzing financial data charts in an outdoor meeting
Коллекция по умолчанию
Коллекция по умолчанию
Создать новую

Tablet with graph bars on black background, created using generative ai technology. Statistics, graphs and charts concept digitally generated image.
Коллекция по умолчанию
Коллекция по умолчанию
Создать новую

Two business people analyzing the data
Коллекция по умолчанию
Коллекция по умолчанию
Создать новую

Image of financial graphs and data over buildings at night. global finance, economy and technology concept digitally generated image.
Коллекция по умолчанию
Коллекция по умолчанию
Создать новую

Image of statistics and financial data processing. Global connections, digital interface, computing and data processing concept digitally generated image.
Коллекция по умолчанию
Коллекция по умолчанию
Создать новую

Graphs paper. Financial development, Banking Account, Statistic, Investment Analytic research data economy.
Коллекция по умолчанию
Коллекция по умолчанию
Создать новую

Graph chart for stock market investment trading
Коллекция по умолчанию
Коллекция по умолчанию
Создать новую

Financial graph on night city scape with tall buildings background double exposure. Analysis concept.
Коллекция по умолчанию
Коллекция по умолчанию
Создать новую

stock market exchange graph illustration concept 3d illustration
Коллекция по умолчанию
Коллекция по умолчанию
Создать новую

Financial graph on night city scape with tall buildings background double exposure. Analysis concept.
Коллекция по умолчанию
Коллекция по умолчанию
Создать новую

UX UI design process for modish mobile application and website . Creative prototype of wireframe for professional app developer .
Коллекция по умолчанию
Коллекция по умолчанию
Создать новую

3d render showing a striking blue and green bar graph prominently displayed on a black background
Коллекция по умолчанию
Коллекция по умолчанию
Создать новую

Business and Technology target set goals and achievement in 2023 new year resolution statistics graph rising revenue, planning to start up strategy, icon concept
Коллекция по умолчанию
Коллекция по умолчанию
Создать новую

Closeup of businesswoman looking at charts on computer
Коллекция по умолчанию
Коллекция по умолчанию
Создать новую

Bio Circular Green Economy concept. Businesswoman point to increasing arrow with carbon reduction for decrease CO2, carbon footprint and carbon credit to limit global warming from climate change.
Коллекция по умолчанию
Коллекция по умолчанию
Создать новую

Business team working on laptop, while sitting at office. Business people.
Коллекция по умолчанию
Коллекция по умолчанию
Создать новую

Charts of financial instruments with various type of indicators including volume analysis for professional technical analysis on the monitor of a computer. Fundamental and technical analysis concept
Коллекция по умолчанию
Коллекция по умолчанию
Создать новую

Image of data processing and lines on black background. Global business and digital interface concept digitally generated image.
Коллекция по умолчанию
Коллекция по умолчанию
Создать новую

Double exposure of businessman using the tablet with cityscape and financial graph on blurred building background, Business Trading concept
Коллекция по умолчанию
Коллекция по умолчанию
Создать новую

Financial analysts analyze business financial reports on a digital tablet planning investment project during a discussion at a meeting of corporate showing the results of their successful teamwork.
Коллекция по умолчанию
Коллекция по умолчанию
Создать новую

abstract background with colorful lines and dots on a black background
Коллекция по умолчанию
Коллекция по умолчанию
Создать новую

3d render of business graph on the background of a financial chart
Коллекция по умолчанию
Коллекция по умолчанию
Создать новую
Candle stick graph chart with indicator showing bullish point or bearish point, up trend or down trend of price of stock market or stock exchange,
Коллекция по умолчанию
Коллекция по умолчанию
Создать новую

Business documents chart on desk.
Коллекция по умолчанию
Коллекция по умолчанию
Создать новую

Stock Market Trading Chart Investment Analysis Business Index Chart Finance Board Chart
Коллекция по умолчанию
Коллекция по умолчанию
Создать новую

Digital marketing 2023 goals. Businessman analyzing internet marketing online, 2023 business planning, business skyrocket, online stock market analysis, stock chart next year, digital stock trading
Коллекция по умолчанию
Коллекция по умолчанию
Создать новую

Image of graphs, trading boards, loading circles over aerial view of modern cityscape. Digital composite, multiple exposure, report, business, stock market, progress and architecture concept.
Коллекция по умолчанию
Коллекция по умолчанию
Создать новую

3D colorful graphs on white background. AI Generative.
Коллекция по умолчанию
Коллекция по умолчанию
Создать новую

Stock market chart. Business graph background. Forex trading. business concept in color
Коллекция по умолчанию
Коллекция по умолчанию
Создать новую
Colorful data visualization of trends over time showing fluctuations in statistics
Коллекция по умолчанию
Коллекция по умолчанию
Создать новую

business graph, chart, diagram, bar
Коллекция по умолчанию
Коллекция по умолчанию
Создать новую

Artificial intelligence ai virtual brain processing and analyzing data streams
Коллекция по умолчанию
Коллекция по умолчанию
Создать новую

Коллекция по умолчанию
Коллекция по умолчанию
Создать новую

Businessmen touching the virtual screen with the stock market changes business growth investment bar chart and other candlesticks connected to trade data. Abstract businessman with outstretched hand
Коллекция по умолчанию
Коллекция по умолчанию
Создать новую

Abstract financial chart with candlestick indicators over a cityscape
Коллекция по умолчанию
Коллекция по умолчанию
Создать новую

show hologram stock Business growth, progress or success concept
Коллекция по умолчанию
Коллекция по умолчанию
Создать новую

Close-up of businesswoman working with graphics tablet in coffee shop
Коллекция по умолчанию
Коллекция по умолчанию
Создать новую

Financial charts and pie graphs image over global data analysis background. Finance, economy, statistics, pie chart, business, metrics
Коллекция по умолчанию
Коллекция по умолчанию
Создать новую

Stock or business market analysis concept. Business financial or stock market background. Business graph on stock market financial exchange
Коллекция по умолчанию
Коллекция по умолчанию
Создать новую

Economic growth concept with charts
Коллекция по умолчанию
Коллекция по умолчанию
Создать новую

stock market graph analysis. Digital analytics and statistics. stats and economics.
Коллекция по умолчанию
Коллекция по умолчанию
Создать новую

Colorful 3d bar graph on dark background. Vector illustration.
Коллекция по умолчанию
Коллекция по умолчанию
Создать новую

Double exposure of virtual creative financial diagram on empty room interior background, banking and accounting concept.
Коллекция по умолчанию
Коллекция по умолчанию
Создать новую

Abstract vector background with 3d mountains and lines. Vector illustration.
Коллекция по умолчанию
Коллекция по умолчанию
Создать новую

Image of light trails over data processing on black background. Global finances, computing and digital interface concept digitally generated image.
Коллекция по умолчанию
Коллекция по умолчанию
Создать новую

3d rendered bar graph in blue and green against a black background photography shot
Коллекция по умолчанию
Коллекция по умолчанию
Создать новую

View of a Business stock exchange trading data information isolated on a background
Коллекция по умолчанию
Коллекция по умолчанию
Создать новую

analysis for professional technical analysis on the monitor of a computer. Fundamental and technical analysis concept.
Коллекция по умолчанию
Коллекция по умолчанию
Создать новую

Image of globe and data processing over business people wearing phone headsets. Global internet security connections and data processing concept digitally generated image.
Коллекция по умолчанию
Коллекция по умолчанию
Создать новую

financial stock market graph on technology abstract background. Finance and investment concept. 3D Rendering
Коллекция по умолчанию
Коллекция по умолчанию
Создать новую

Background with financial charts. Neon colors. The concept of analytics, business or trading on the financial exchange. Vector.
Коллекция по умолчанию
Коллекция по умолчанию
Создать новую
Heart cardiogram interface. 3D Rendering
Коллекция по умолчанию
Коллекция по умолчанию
Создать новую

Businessman or Manager work with financial paper report, business planing and analysis of growth concept.
Коллекция по умолчанию
Коллекция по умолчанию
Создать новую

Abstract Graph Showing Business Growth On Upwards Trend, Business And Technology Concept,
Коллекция по умолчанию
Коллекция по умолчанию
Создать новую

Chalkboard with finance business graph drawn on a blackboard
Коллекция по умолчанию
Коллекция по умолчанию
Создать новую

Business person evaluates metrics for business growth, setting goals for expansion. Insights on fostering continuous business growth through innovation and strategy 2025. UUID
Коллекция по умолчанию
Коллекция по умолчанию
Создать новую

Top down view of start up business team holding paper while discussing about financial idea. Aerial view of smart diverse people brainstorming idea while looking at stock market statistic. Symposium.
Коллекция по умолчанию
Коллекция по умолчанию
Создать новую

Stock market graph background. Life savings and financial markets concept. Wealth and opportunity idea. Copy space.
Коллекция по умолчанию
Коллекция по умолчанию
Создать новую

Dashboard infographic big data visualization, binary option, monitor screen in perspective, statistics and market analysis illustration
Коллекция по умолчанию
Коллекция по умолчанию
Создать новую

Close-up view of business document with charts and graphs, blue pen on a wooden table.
Коллекция по умолчанию
Коллекция по умолчанию
Создать новую

Chart of the Crypto-currency on the chalkboard, a display of growth and decline. The concept of choice for trading on the stock exchange.
Коллекция по умолчанию
Коллекция по умолчанию
Создать новую

Businessman analysis profitability of working companies with digital augmented reality graphics, positive indicators in 2023, businessman calculates financial data for long term investments.
Коллекция по умолчанию
Коллекция по умолчанию
Создать новую

A detailed view capturing the vibrant colors and intricate buttons of a sound board used in audio production, Graph illustrating dividend yields by sector, AI Generated
Коллекция по умолчанию
Коллекция по умолчанию
Создать новую
Businessman planning growth future in his business on a virtual screen. SWOT analysis and strategic marketing. Business development and growth concept
Коллекция по умолчанию
Коллекция по умолчанию
Создать новую

Generative AI : Business finance and investment world economic growth concept Forex financial graph chart market report on night cityscape for business and finance background
Коллекция по умолчанию
Коллекция по умолчанию
Создать новую

Graph line stock market business forex trading and analysis investment indicator of financial board display money price stock chart exchange growth and digital background
Коллекция по умолчанию
Коллекция по умолчанию
Создать новую
Legion-Media
Создайте свои проекты на основе качественных стоковых фотографий и видео.


Copyright © Legion-Media.