
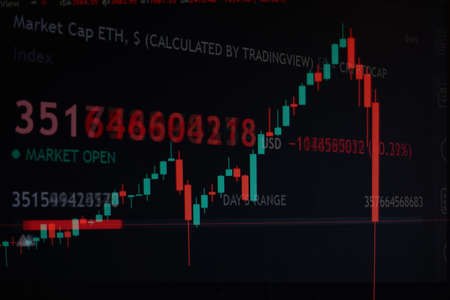
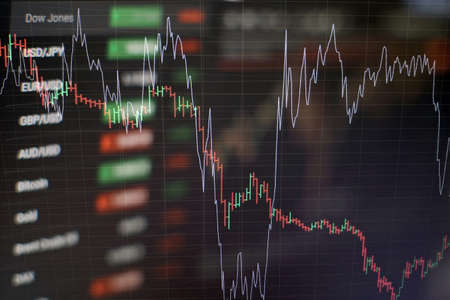
Sustainable portfolio management, long term wealth management with risk diversification concept.
Коллекция по умолчанию
Коллекция по умолчанию
Создать новую
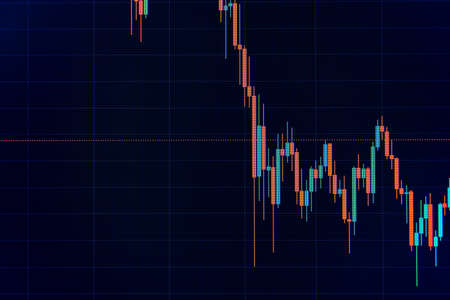
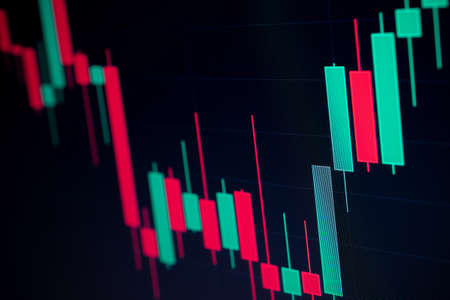
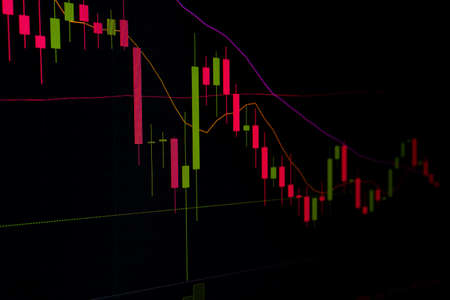
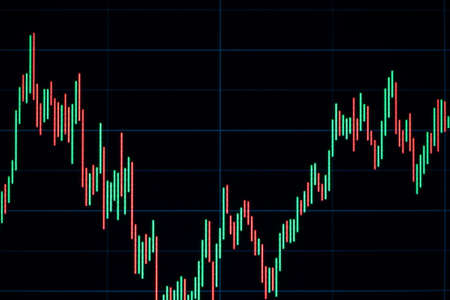
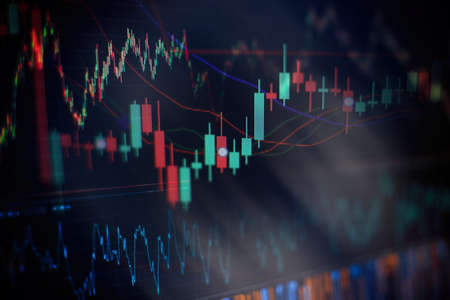
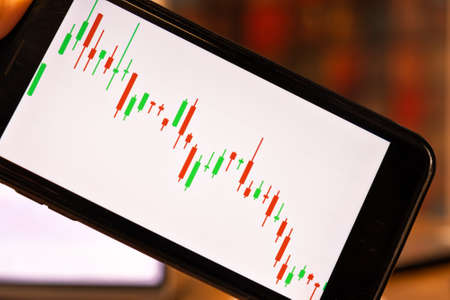
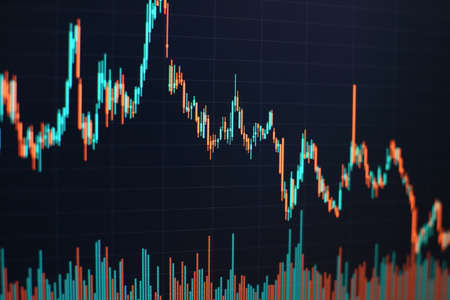
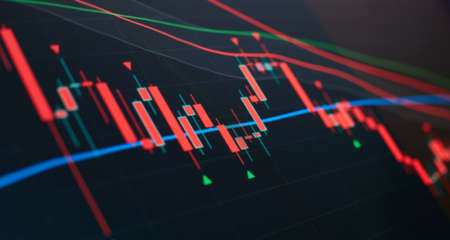
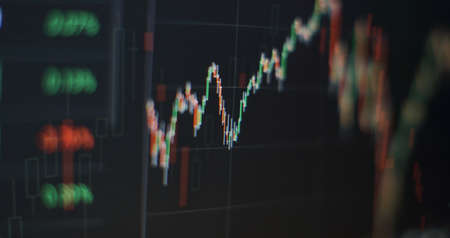
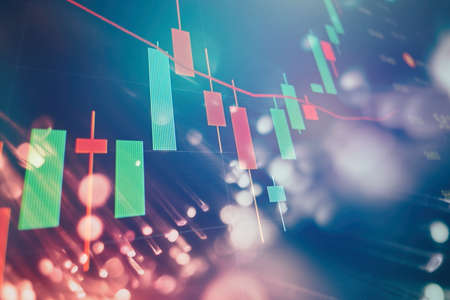
Close up shot on digital screen Candlestick Chart of stock market change and volatility prices profit or loss
Коллекция по умолчанию
Коллекция по умолчанию
Создать новую
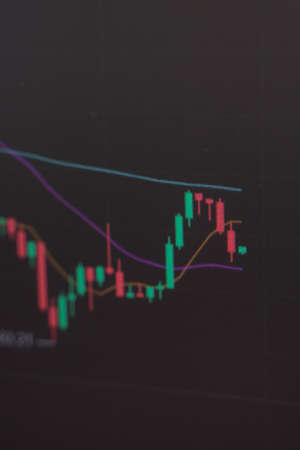
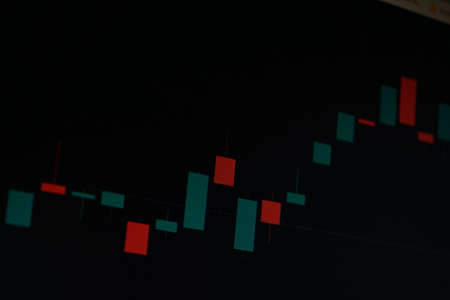
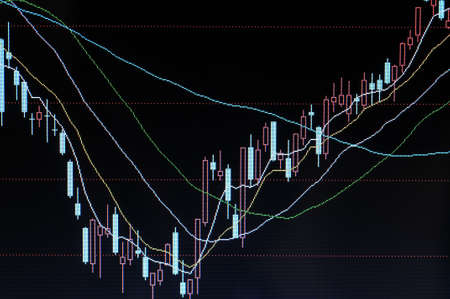
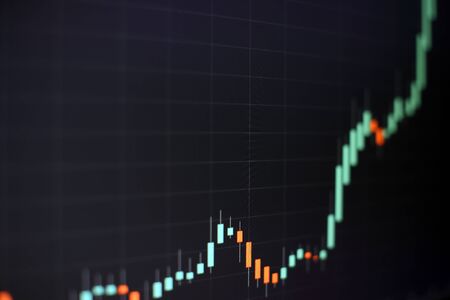
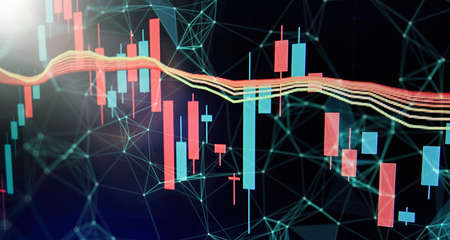
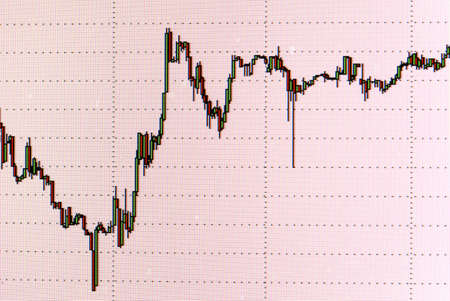
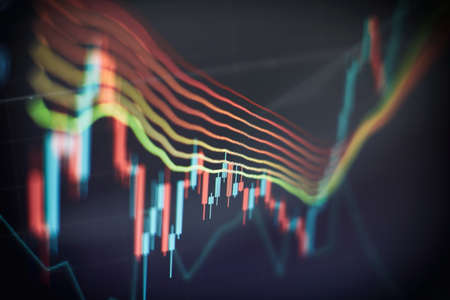
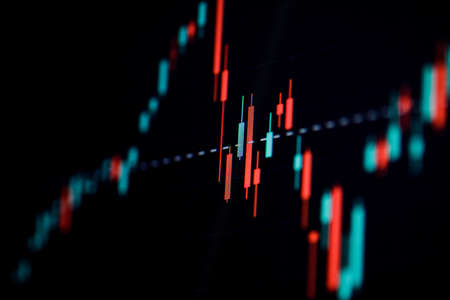
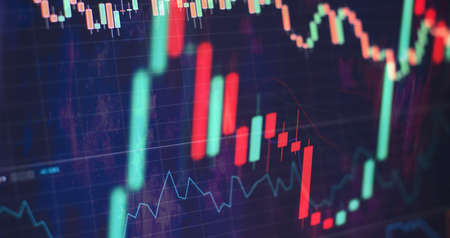
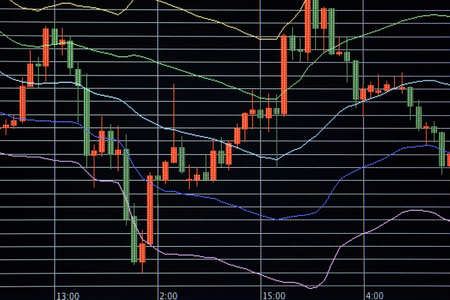
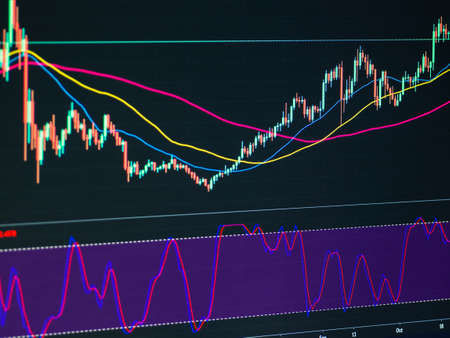
Forex graph business or Stock graph chart market exchange ,Technical price candlestick with indicator on chart computer screen background, Stock trading graphic design for financial investment trade
Коллекция по умолчанию
Коллекция по умолчанию
Создать новую

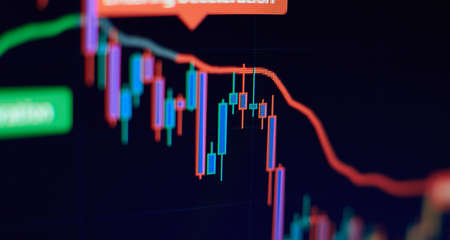
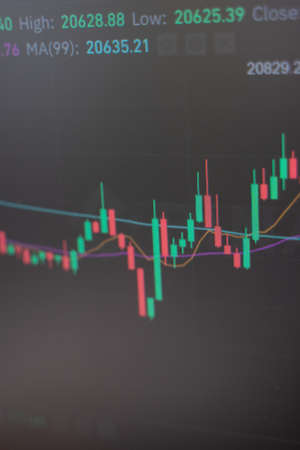
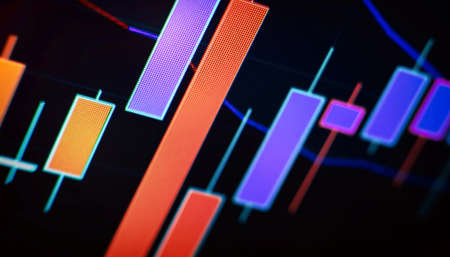
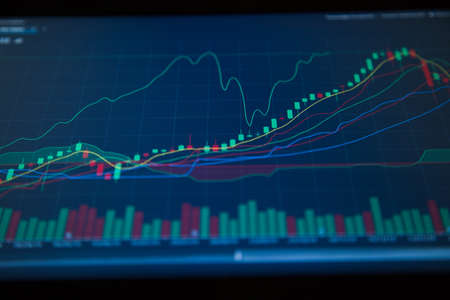
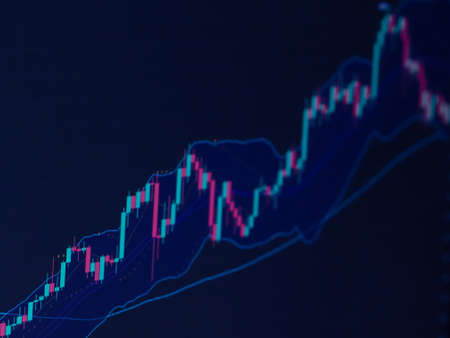
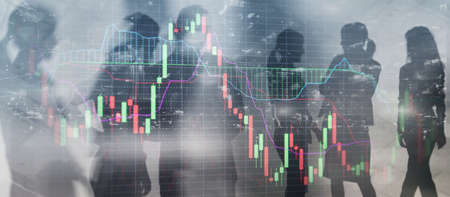
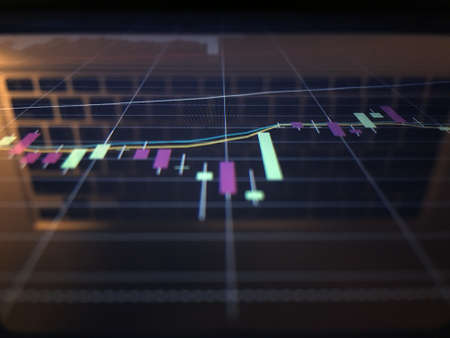
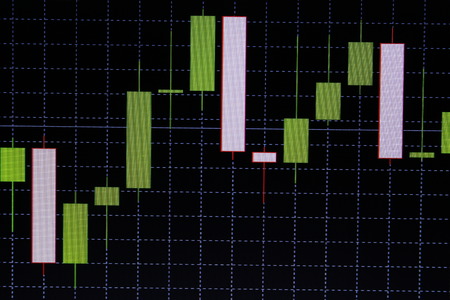
Shallow depth of field (selective focus) with details of a candlestick chart on a computer screen.
Коллекция по умолчанию
Коллекция по умолчанию
Создать новую
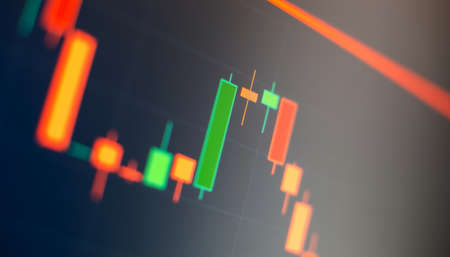
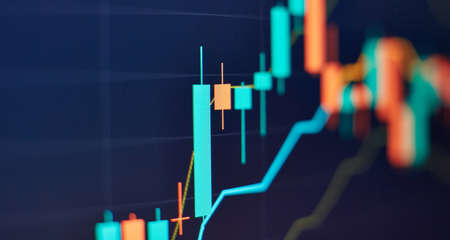
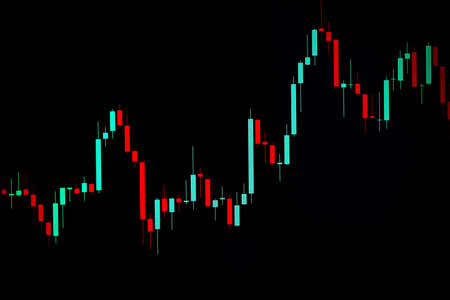
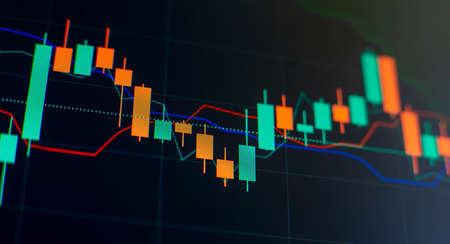
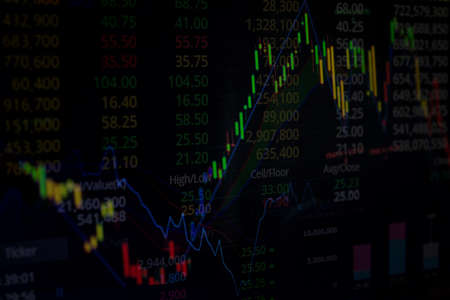
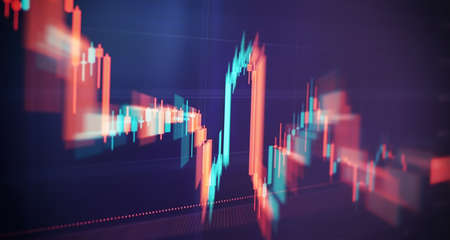
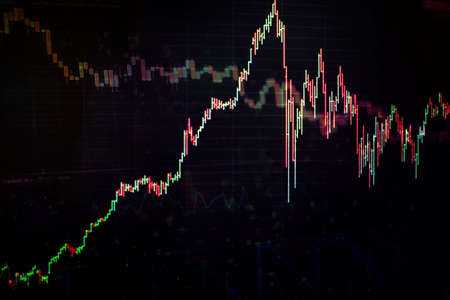
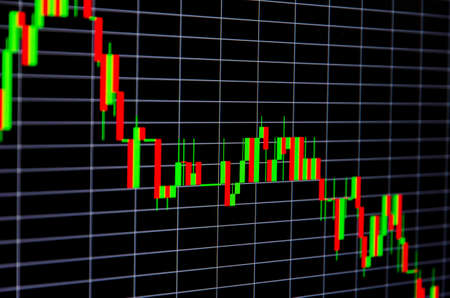
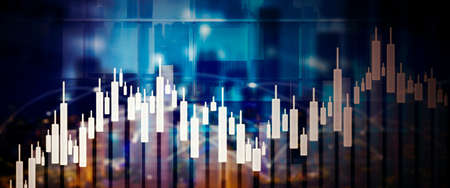
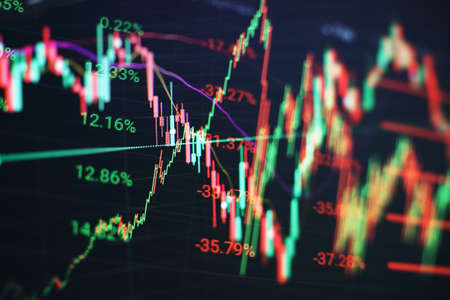
Charts graphs. Financial chart, stock analysis data for business background in digital screen. Graphics growth forex finance market. Trading candlestick chart, cryptocurrency digital economy
Коллекция по умолчанию
Коллекция по умолчанию
Создать новую
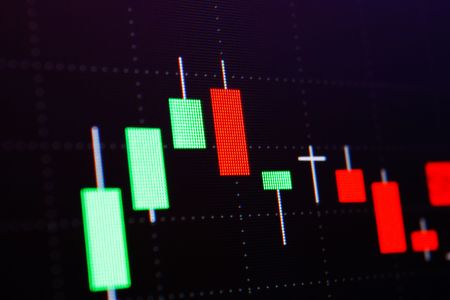
Shallow depth of field (selective focus) with details of a candlestick chart on a computer screen.
Коллекция по умолчанию
Коллекция по умолчанию
Создать новую
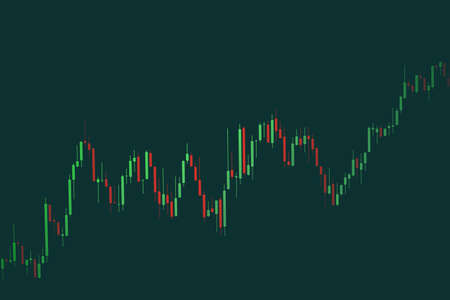
Business graph. Bullish Bearish trend. Candlestick chart uptrend downtrend . Stock trade on online market forex.
Коллекция по умолчанию
Коллекция по умолчанию
Создать новую
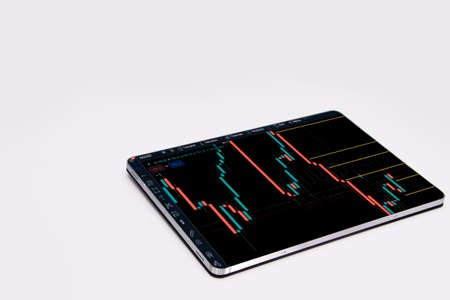
Stock market chart. Graphics growth forex finance market on tablet screen. Financial chart, stock analysis data background. Business growth, progress or success concept
Коллекция по умолчанию
Коллекция по умолчанию
Создать новую
Business or Financial Reference: Displaying stock market data, stock exchange or chart on a monitor, stock market chart, stock exchange or chart. stock market investment trading chart.
Коллекция по умолчанию
Коллекция по умолчанию
Создать новую
Financial stock market graph. Stock Exchange. Selective focus.
Коллекция по умолчанию
Коллекция по умолчанию
Создать новую

Business and finance strategy. Data analytics for stock market investing.
Коллекция по умолчанию
Коллекция по умолчанию
Создать новую
Bitcoin. Change the price on the display. Brokerage information, display of the price of the electronic means of payment
Коллекция по умолчанию
Коллекция по умолчанию
Создать новую
Stock or business market analysis concept. Business financial or stock market background.
Коллекция по умолчанию
Коллекция по умолчанию
Создать новую
business candlestick. Financial static analysis with growing financial charts. Online trading, Investment, Strategy market plan, and Stock market fluctuations Concept.
Коллекция по умолчанию
Коллекция по умолчанию
Создать новую
Investment planning. Graphics growth forex finance market on tablet screen. Financial chart, stock analysis data. Business strategy, financial and banking digital marketing
Коллекция по умолчанию
Коллекция по умолчанию
Создать новую
Stock Market Trading Chart Investment Analysis Business Index Chart Finance Board Chart
Коллекция по умолчанию
Коллекция по умолчанию
Создать новую

Shallow depth of field (selective focus) with details of a candlestick chart on a computer screen.
Коллекция по умолчанию
Коллекция по умолчанию
Создать новую
Change the stock market chart. The fall in the value of cryptocurrencies. Brokerage data
Коллекция по умолчанию
Коллекция по умолчанию
Создать новую
Economy trends background for business idea and all art work design. Abstract finance background.
Коллекция по умолчанию
Коллекция по умолчанию
Создать новую
securities price chart on the monitor screen i
Коллекция по умолчанию
Коллекция по умолчанию
Создать новую
A live stock market billboard with gains and losses curves
Коллекция по умолчанию
Коллекция по умолчанию
Создать новую
Analysis for professional technical analysis on the monitor of a computer. Fundamental and technical analysis concept.
Коллекция по умолчанию
Коллекция по умолчанию
Создать новую
Business candle stick graph chart of stock market investment trading on background design / Trend of stock graph market exchange financial economy concept
Коллекция по умолчанию
Коллекция по умолчанию
Создать новую
Stock Market Trading Chart Investment Analysis Business Index Chart Finance Board Chart
Коллекция по умолчанию
Коллекция по умолчанию
Создать новую

Stock index on the computer monitor . Financial data on a monitor which including of Market Analyze. Bar graphs, Diagrams, financial figures.
Коллекция по умолчанию
Коллекция по умолчанию
Создать новую
Economic graphic. Financial chart, stock analysis data for business background in digital screen. Graphics growth forex finance market. Stock analyzing. Price chart bars
Коллекция по умолчанию
Коллекция по умолчанию
Создать новую
Economic graph with diagrams on the stock market, for business and financial concepts and reports.
Коллекция по умолчанию
Коллекция по умолчанию
Создать новую
Stock Market Chart on Blue Background. share drop down and stock up
Коллекция по умолчанию
Коллекция по умолчанию
Создать новую
Graph chart with indicator showing bullish point or bearish point, up trend or down trend of price of stock market or stock exchange trading, investment and financial concept. thin focus.
Коллекция по умолчанию
Коллекция по умолчанию
Создать новую

Stock index on the computer monitor . Financial data on a monitor which including of Market Analyze. Bar graphs, Diagrams, financial figures.
Коллекция по умолчанию
Коллекция по умолчанию
Создать новую
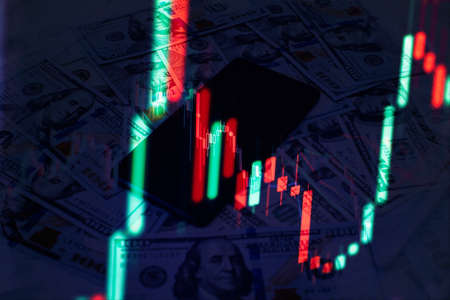
Bitcoin cryptocurrency coins exchange graph screen. web3.0 blockchain technology graph scene altcoins, business finance, digital money market. US Dollar currency in economy adoption.
Коллекция по умолчанию
Коллекция по умолчанию
Создать новую

gold unicorn chess and business chart for start up concept 3d rendering
Коллекция по умолчанию
Коллекция по умолчанию
Создать новую

A stock market or Forex trading chart and a candlestick chart suitable for the concept of financial investments. Business candlestick graph chart of stock market investment trading
Коллекция по умолчанию
Коллекция по умолчанию
Создать новую

Stock or business market analysis concept. Business financial or stock market background. Business graph on stock market financial exchange
Коллекция по умолчанию
Коллекция по умолчанию
Создать новую

The business plan at the meeting and analyze financial numbers to view the performance of the company.
Коллекция по умолчанию
Коллекция по умолчанию
Создать новую
Business success and growth concept. Stock market business graph chart on digital screen. Forex market, Gold market and Crude oil market.
Коллекция по умолчанию
Коллекция по умолчанию
Создать новую
Investment, trade, stock, finance and analysis , Economic graph with diagrams on the stock market, for business and financial concepts
Коллекция по умолчанию
Коллекция по умолчанию
Создать новую

Working set for analyzing financial statistics and analyzing a market data. Data analyzing from charts and graph to find out the result.
Коллекция по умолчанию
Коллекция по умолчанию
Создать новую
Business graph. Bullish Bearish trend. Candlestick chart uptrend downtrend . Stock trade on online market forex.
Коллекция по умолчанию
Коллекция по умолчанию
Создать новую
the curve on the screen
Коллекция по умолчанию
Коллекция по умолчанию
Создать новую
Stock Market Loss Trading Chart Investment Analysis Business Index Chart Finance Board Chart
Коллекция по умолчанию
Коллекция по умолчанию
Создать новую
Business candle stick graph chart of stock market investment trading on background design / Trend of stock graph market exchange financial economy concept
Коллекция по умолчанию
Коллекция по умолчанию
Создать новую
The business plan at the meeting and analyze financial numbers to view the performance of the company in stock market exchange.
Коллекция по умолчанию
Коллекция по умолчанию
Создать новую
Business financial or stock market background. Business graph on stock market financial exchange
Коллекция по умолчанию
Коллекция по умолчанию
Создать новую
The business plan at the meeting and analyze financial numbers to view the performance of the company.
Коллекция по умолчанию
Коллекция по умолчанию
Создать новую
Business statistics and Analytics value . Abstract glowing forex chart interface background. Investment, trade, stock, finance and analysis concept.
Коллекция по умолчанию
Коллекция по умолчанию
Создать новую
Close up n hand holding smart phone with candle graph for trade stock market investment crypto currency
Коллекция по умолчанию
Коллекция по умолчанию
Создать новую
Abstract graphic consisting of blurred points , graph and chart . information concept.
Коллекция по умолчанию
Коллекция по умолчанию
Создать новую
A defocused candlestick chart with an indicator showing an uptrend or downtrend in stock market or online stock trading, investment and financial concepts.
Коллекция по умолчанию
Коллекция по умолчанию
Создать новую
financial instruments with various types of indicators including volume analysis for professional technical analysis on the monitor of a computer.
Коллекция по умолчанию
Коллекция по умолчанию
Создать новую
concept investment. Moving average graph .Stock market graph on technology abstract background
Коллекция по умолчанию
Коллекция по умолчанию
Создать новую
Analysis of business chart and online financial market data with digital pen close up background
Коллекция по умолчанию
Коллекция по умолчанию
Создать новую
Closeup financial chart in stock market on monitor background. Chart graph as investment concept. Crisis background, red chart
Коллекция по умолчанию
Коллекция по умолчанию
Создать новую

Abstract glowing forex chart interface wallpaper. Investment, trade, stock
Коллекция по умолчанию
Коллекция по умолчанию
Создать новую

A financial foreign exchange chart on a black background showing signs of uptrend
Коллекция по умолчанию
Коллекция по умолчанию
Создать новую

image is a graph of financial development on a computer monitor.
Коллекция по умолчанию
Коллекция по умолчанию
Создать новую
Stock trading, crypto currency background.The business plan at the meeting and analyze financial numbers to view the performance of the company.
Коллекция по умолчанию
Коллекция по умолчанию
Создать новую
Fundamental and technical analysis concept.
Коллекция по умолчанию
Коллекция по умолчанию
Создать новую

Chart on LED display concept. A large display of daily stock market price and quotation. indicator financial forex trade
Коллекция по умолчанию
Коллекция по умолчанию
Создать новую
Shallow depth of field (selective focus) with details of a candlestick chart on a computer screen.
Коллекция по умолчанию
Коллекция по умолчанию
Создать новую
Display of quotes pricing graph visualization. Stock market graph and bar chart price display.
Коллекция по умолчанию
Коллекция по умолчанию
Создать новую
diagram
Коллекция по умолчанию
Коллекция по умолчанию
Создать новую
Abstract financial trading graphs on monitor. Background with currency bars and candles
Коллекция по умолчанию
Коллекция по умолчанию
Создать новую
Shallow depth of field (selective focus) with details of a candlestick chart on a computer screen.
Коллекция по умолчанию
Коллекция по умолчанию
Создать новую

Business success and growth concept.Stock market business graph chart on digital screen.Forex market, Gold market and Crude oil market
Коллекция по умолчанию
Коллекция по умолчанию
Создать новую
Stock exchange market chart background. Candle stick graph chart with indicator.
Коллекция по умолчанию
Коллекция по умолчанию
Создать новую
Professional dividend multiplication. Trading stocks. World demand analysis
Коллекция по умолчанию
Коллекция по умолчанию
Создать новую
Businessman hand working on analyzing investment charts for Gold market, Forex market and Trading market.
Коллекция по умолчанию
Коллекция по умолчанию
Создать новую
Working set for analyzing financial statistics and analyzing a market data. Data analyzing from charts and graph to find out the result.
Коллекция по умолчанию
Коллекция по умолчанию
Создать новую
Financial growth graph. Sales increase, marketing strategy concept
Коллекция по умолчанию
Коллекция по умолчанию
Создать новую
Foreign exchange price information
Коллекция по умолчанию
Коллекция по умолчанию
Создать новую
Foreign exchange market chart
Коллекция по умолчанию
Коллекция по умолчанию
Создать новую
Technical price graph and indicator, red and green candlestick chart on blue theme screen, market volatility, up and down trend. Stock trading, crypto currency background.
Коллекция по умолчанию
Коллекция по умолчанию
Создать новую
Double exposure of candlesticks graph with window of office and blurred sparkling light background in the cyberspace
Коллекция по умолчанию
Коллекция по умолчанию
Создать новую
Thailand Stock Exchange, Trading screen, Stock market.
Коллекция по умолчанию
Коллекция по умолчанию
Создать новую

Businessman hand working on analyzing investment charts for Gold market, Forex market and Trading market.
Коллекция по умолчанию
Коллекция по умолчанию
Создать новую
Businessman hand working on analyzing investment charts for Gold market, Forex market and Trading market.
Коллекция по умолчанию
Коллекция по умолчанию
Создать новую
Background of Stock market graph chart on LED display. Trading concept
Коллекция по умолчанию
Коллекция по умолчанию
Создать новую
Business success and growth concept. Stock market business graph chart on digital screen. Forex market, Gold market and Crude oil market.
Коллекция по умолчанию
Коллекция по умолчанию
Создать новую
Economic graphic. Financial chart, stock analysis data for business background in digital screen. Graphics growth forex finance market. Stock analyzing. Price chart bars
Коллекция по умолчанию
Коллекция по умолчанию
Создать новую
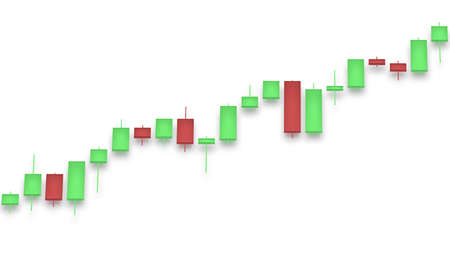
Market chart with color bars 3D rendering on white background
Коллекция по умолчанию
Коллекция по умолчанию
Создать новую
stock indexes in virtual space. Economic growth, recession. Electronic virtual platform showing trends and stock market fluctuations
Коллекция по умолчанию
Коллекция по умолчанию
Создать новую

bitcoin cryptocurrency data charts
Коллекция по умолчанию
Коллекция по умолчанию
Создать новую

Business success and growth concept. Stock market business graph chart on digital screen. Forex market, Gold market and Crude oil market.
Коллекция по умолчанию
Коллекция по умолчанию
Создать новую
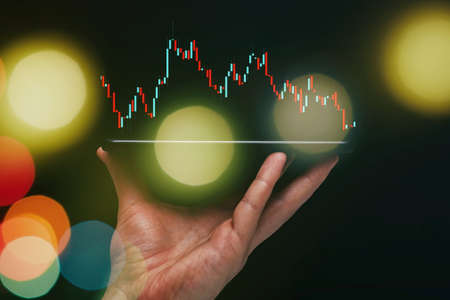
Stock market, Business growth, progress or success concept. Hand of Businessman or trader is showing a growing virtual hologram stock on smartphone
Коллекция по умолчанию
Коллекция по умолчанию
Создать новую
indicators including volume analysis for professional technical analysis on the monitor of a computer. Fundamental and technical analysis concept.
Коллекция по умолчанию
Коллекция по умолчанию
Создать новую
Tablet Index, Exchange Trading Forex Finance Graphic Concept
Коллекция по умолчанию
Коллекция по умолчанию
Создать новую
A close-up financial chart with an uptrend line candle chart on the stock or cryptocurrency market on a black monitor background. Investment chart of the stock or cryptocurrency market with indicators
Коллекция по умолчанию
Коллекция по умолчанию
Создать новую
Economic graph with diagrams on the stock market, for business and financial concepts and reports.Abstract blue background.
Коллекция по умолчанию
Коллекция по умолчанию
Создать новую

Trading which including of Corporate, Fix income, Bond valuation, Government bond, Secularization and Municipal. Wealth management with risk diversification concept.
Коллекция по умолчанию
Коллекция по умолчанию
Создать новую
Foreign exchange market concept
Коллекция по умолчанию
Коллекция по умолчанию
Создать новую
graph with diagrams on the stock market, for business and financial concepts and reports.Abstract blue background.
Коллекция по умолчанию
Коллекция по умолчанию
Создать новую
Double exposure of graph Stock market exchange on blurred photo of city scenery background, business trading, construction and technology concept.
Коллекция по умолчанию
Коллекция по умолчанию
Создать новую

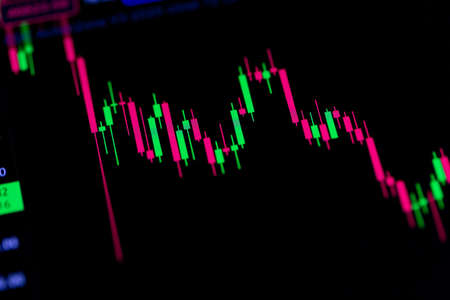
A red-green chart of Japanese candlesticks showing a descending market on a black background. stock market chart background. stock futures trading. Online trading on a stock or crypto exchange
Коллекция по умолчанию
Коллекция по умолчанию
Создать новую
The fall of coronavirus exchanges . Data analyzing in Forex, Commodities, Equities, Fixed Income and Emerging Markets: the charts and summary info show about Business statistics and Analytics value - Wealth management concept.
Коллекция по умолчанию
Коллекция по умолчанию
Создать новую

Creating product value with your own hands, growing your business,3d rendering.
Коллекция по умолчанию
Коллекция по умолчанию
Создать новую
The market volatility of crypto trading with technical price graph and indicator, red and green candlesticks, for analysis up and downtrend. Stock trading, crypto currency background concept.
Коллекция по умолчанию
Коллекция по умолчанию
Создать новую
Fundamental and technical analysis concept. Abstract financial trading graphs on monitor. Background with currency bars and candles
Коллекция по умолчанию
Коллекция по умолчанию
Создать новую

Bitcoin market price candlesticks on the crypto trading terminal screen. Cryptocurrency exchange
Коллекция по умолчанию
Коллекция по умолчанию
Создать новую
Close-up of a financial trading chart displaying colorful candlestick patterns. The vibrant colors represent market movements and trading activities in modern finance.
Коллекция по умолчанию
Коллекция по умолчанию
Создать новую
Legion-Media
Создайте свои проекты на основе качественных стоковых фотографий и видео.


Copyright © Legion-Media.