
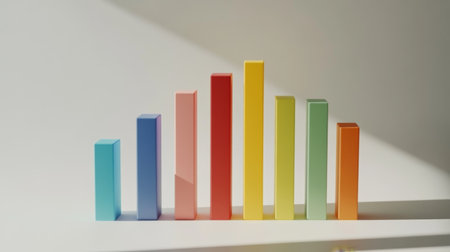
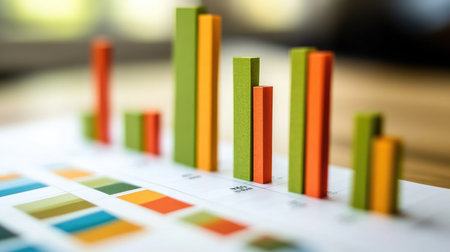
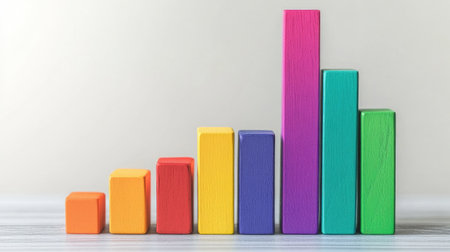
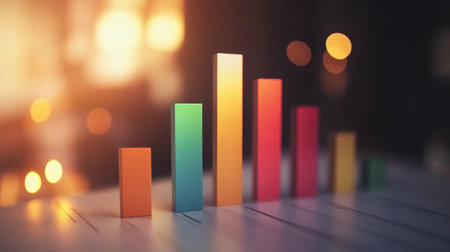
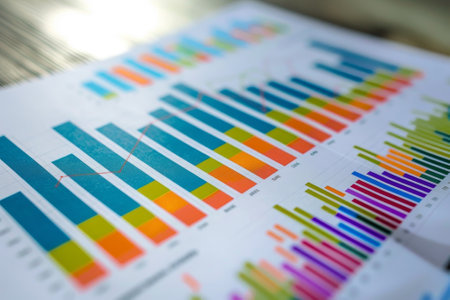
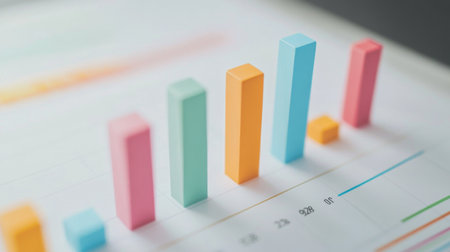
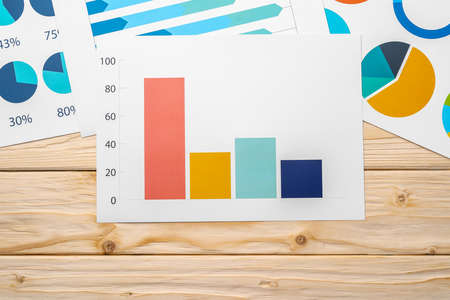
A bar chart displaying quarterly revenue growth for a successful business, with colorful bars rising high.
Коллекция по умолчанию
Коллекция по умолчанию
Создать новую

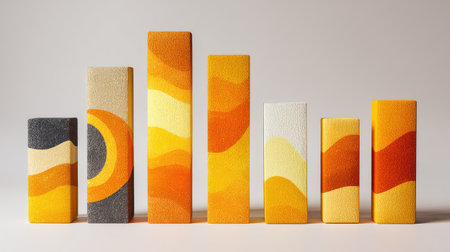
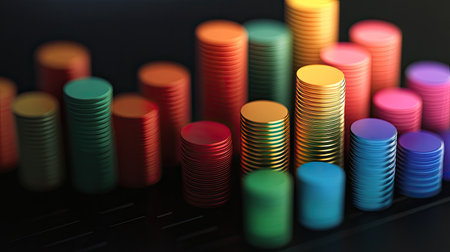
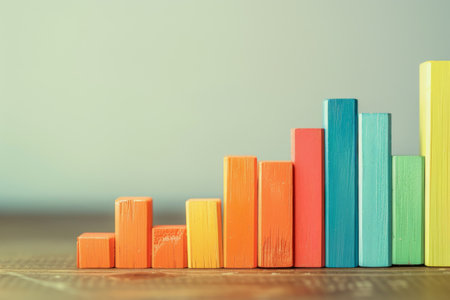
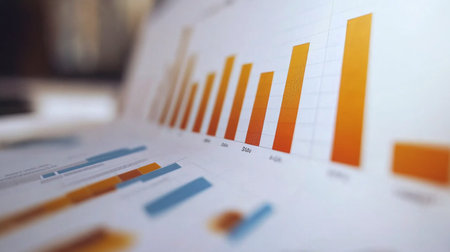
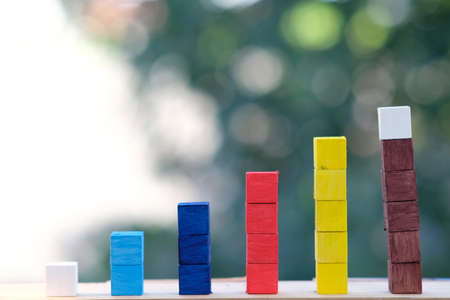
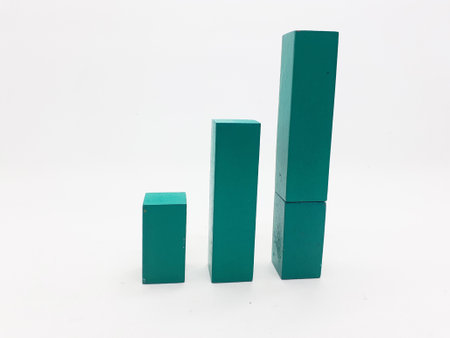
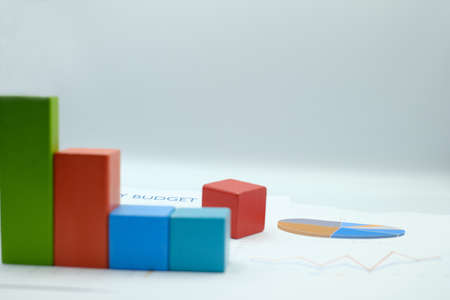
Close up image of colored wooden blocks as a graph
Коллекция по умолчанию
Коллекция по умолчанию
Создать новую
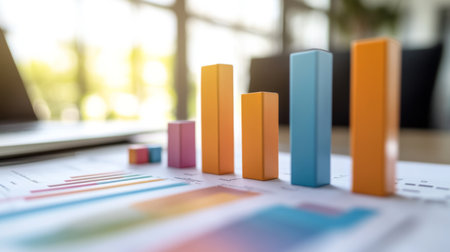
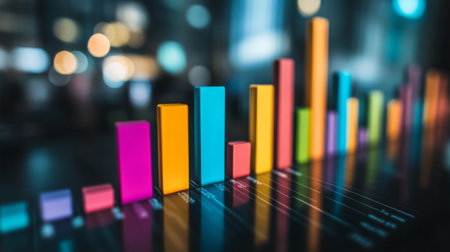
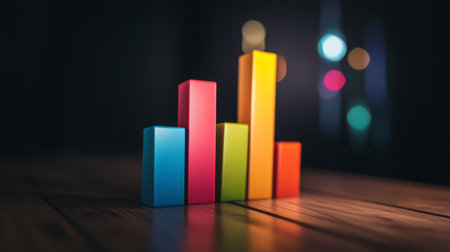
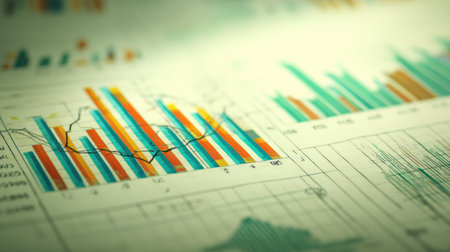
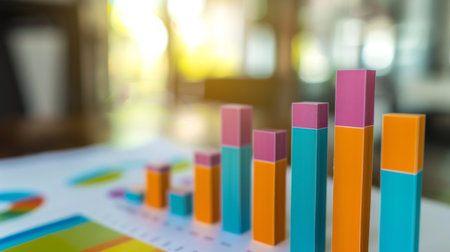
Colorful wooden blocks on the table in the office, business concept
Коллекция по умолчанию
Коллекция по умолчанию
Создать новую

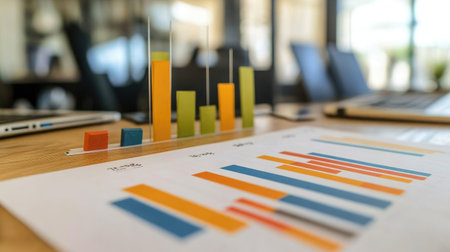
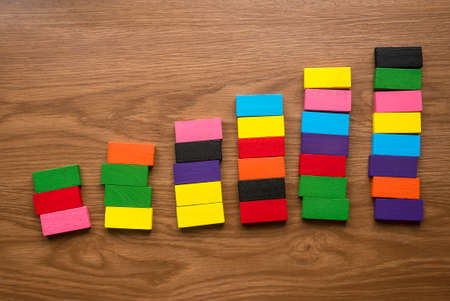
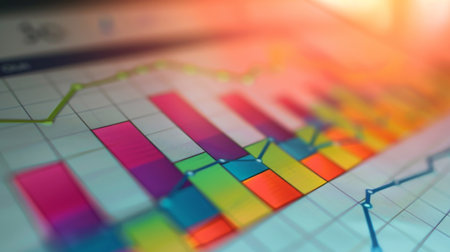
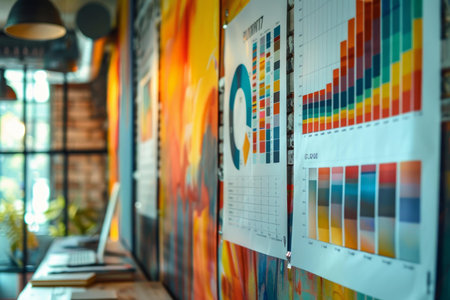
A multi-hued building with numerous windows stands out in vibrant colors against the surrounding cityscape, Colorful bar graphs displaying sales data, AI Generated
Коллекция по умолчанию
Коллекция по умолчанию
Создать новую
Business graph diagram with multicolored bars with rise dynamic against blue background
Коллекция по умолчанию
Коллекция по умолчанию
Создать новую
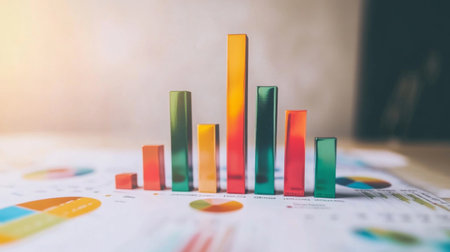
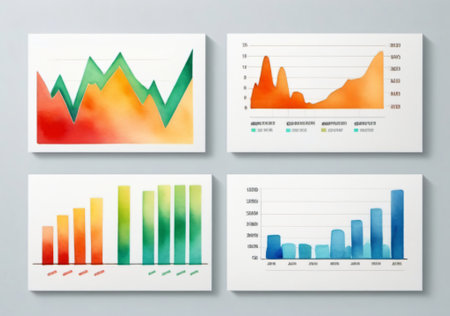
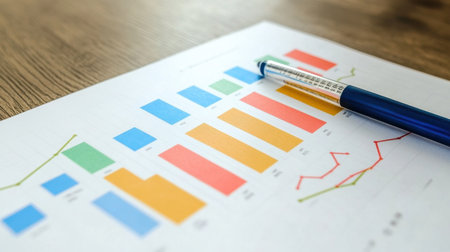
A close-up of a business report with colorful bar and line graphs.
Коллекция по умолчанию
Коллекция по умолчанию
Создать новую
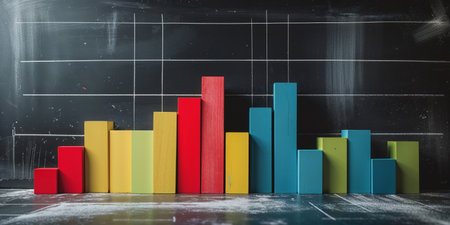
AI Generated. Colorful wooden blocks arranged in bar graph on blackboard surface
Коллекция по умолчанию
Коллекция по умолчанию
Создать новую
A vibrant arrangement of colorful wooden blocks illustrating growth and progress. This image can be used in business, education, or creativity themes.
Коллекция по умолчанию
Коллекция по умолчанию
Создать новую
A detailed close-up of a business bar graph with glossy bars, showcasing performance metrics, against a light background with soft focus elements for a professional look.
Коллекция по умолчанию
Коллекция по умолчанию
Создать новую

Colorful bar charts and line graphs representing financial data, illustrating the performance and trajectory of a successful business.
Коллекция по умолчанию
Коллекция по умолчанию
Создать новую
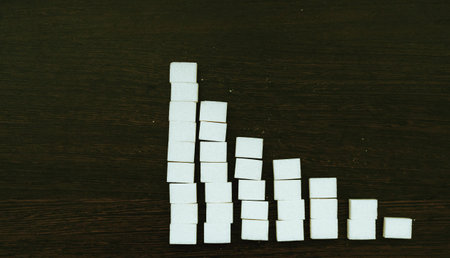
Sugar cubes are stacked in a column in an increasing direction on a dark background. Harmful to health. Diabetes.
Коллекция по умолчанию
Коллекция по умолчанию
Создать новую
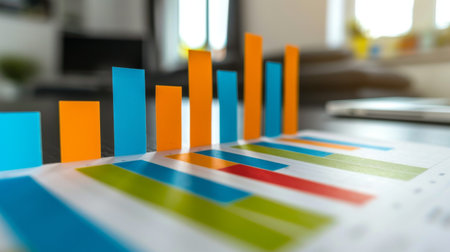
A close-up view of colorful bar graphs and charts on a desk, representing data analysis and business performance. Ideal for topics on statistics and growth.
Коллекция по умолчанию
Коллекция по умолчанию
Создать новую
A vibrant arrangement of textured blocks showcases a playful blend of warm colors, including yellow, orange, and gray. The shapes create a modern, artistic expression.
Коллекция по умолчанию
Коллекция по умолчанию
Создать новую
Vibrant bar graphs and charts on a table illustrate business analysis and data visualization, showcasing growth and performance metrics in a professional setting.
Коллекция по умолчанию
Коллекция по умолчанию
Создать новую

3d render graph over gray background, rainbow business infographic, panoramic layout
Коллекция по умолчанию
Коллекция по умолчанию
Создать новую
Vibrant bar graphs displayed on an office desk, showcasing business metrics and statistics. Ideal for content related to finance, analysis, and performance.
Коллекция по умолчанию
Коллекция по умолчанию
Создать новую
Creative bar graph made from colorful blocks, set against a white minimalist background
Коллекция по умолчанию
Коллекция по умолчанию
Создать новую

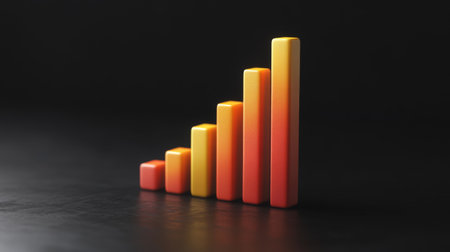
A digital bar graph with sleek, metallic colors, displayed on a black reflective background, with lines and highlights creating depth
Коллекция по умолчанию
Коллекция по умолчанию
Создать новую
Business cost diagram in 3D layers with colors, copy space provided.
Коллекция по умолчанию
Коллекция по умолчанию
Создать новую

Close-up of a stock market analysis chart with a mix of bar graphs and line graphs highlighting key data
Коллекция по умолчанию
Коллекция по умолчанию
Создать новую
A vibrant bar graph illustrating company earnings with colorful metrics, designed for business analysis. Perfect for presentations and financial reports.
Коллекция по умолчанию
Коллекция по умолчанию
Создать новую
A colorful wooden block with an arrangement of stair or graph.
Коллекция по умолчанию
Коллекция по умолчанию
Создать новую

Virus pandemic covid-19 map on pc screen, global infection, internet.
Коллекция по умолчанию
Коллекция по умолчанию
Создать новую
Colorful rectangular blocks arranged in a pattern, showcasing varying heights and vibrant hues against a white background.
Коллекция по умолчанию
Коллекция по умолчанию
Создать новую
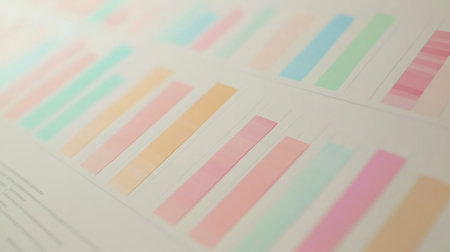
This image features a colorful bar graph on paper, showcasing pastel-colored bars that represent various data points, ideal for business and educational uses.
Коллекция по умолчанию
Коллекция по умолчанию
Создать новую
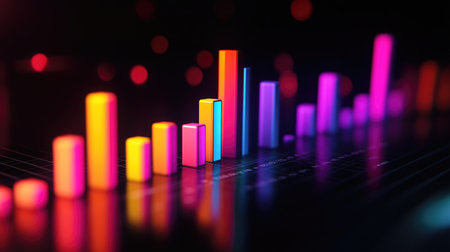
A vibrant bar chart displayed on a dark surface, showcasing data analysis and statistical trends, ideal for business presentations and reports.
Коллекция по умолчанию
Коллекция по умолчанию
Создать новую

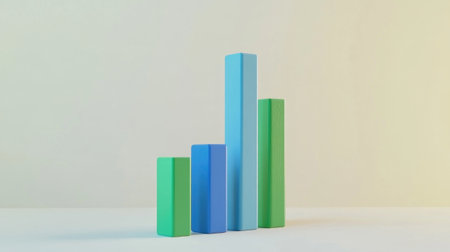
Leadership concept with one red geometric figure next to blue others of different shapes against blue background. Outstanding red geometric figure leading among others
Коллекция по умолчанию
Коллекция по умолчанию
Создать новую

Colorful wooden blocks in a row on the background of a graph
Коллекция по умолчанию
Коллекция по умолчанию
Создать новую
A colorful bar chart showing quarterly sales growth for a tech startup, with upward trends highlighted
Коллекция по умолчанию
Коллекция по умолчанию
Создать новую

ballpoint pen indicates income graphs lying on the table
Коллекция по умолчанию
Коллекция по умолчанию
Создать новую

business graph with pen
Коллекция по умолчанию
Коллекция по умолчанию
Создать новую

Row of vibrant wooden arrows displayed against a clean white wall.
Коллекция по умолчанию
Коллекция по умолчанию
Создать новую
A stacked bar graph with soft shadows and gradient colors on a white surface, emphasizing financial or analytical data structure
Коллекция по умолчанию
Коллекция по умолчанию
Создать новую

Vibrant bar graphs illustrate data trends in a modern business environment. The colorful visualization captures attention and conveys insights effectively.
Коллекция по умолчанию
Коллекция по умолчанию
Создать новую
business background grown up concept the business chart document background.
Коллекция по умолчанию
Коллекция по умолчанию
Создать новую
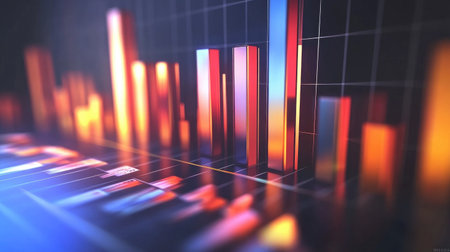
A financial dashboard displaying a D bar graph with colorful rising bars, set against a dark background with subtle lighting effects.
Коллекция по умолчанию
Коллекция по умолчанию
Создать новую
Financial paper with charts and diagrams on gray table
Коллекция по умолчанию
Коллекция по умолчанию
Создать новую

Colored sticker stripes on business analytics chart closeup
Коллекция по умолчанию
Коллекция по умолчанию
Создать новую

This image features a colorful bar graph on paper, showcasing pastel-colored bars that represent various data points, ideal for business and educational uses.
Коллекция по умолчанию
Коллекция по умолчанию
Создать новую
A vibrant display of pastel color swatches arranged on a light background, ideal for exploring color combinations and creative design concepts. Perfect for artists and designers.
Коллекция по умолчанию
Коллекция по умолчанию
Создать новую
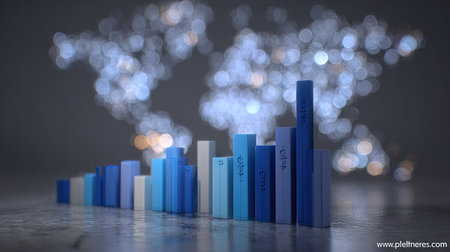
An image showcases an abstract chart composed of blue and white bars, likely representing data. The background is a blurred map with soft lighting, suggesting a global context. The composition emphasizes a modern, digital aesthetic, suitable for presentations or marketing materials. It could be used in business, finance or data analysis contexts.
Коллекция по умолчанию
Коллекция по умолчанию
Создать новую

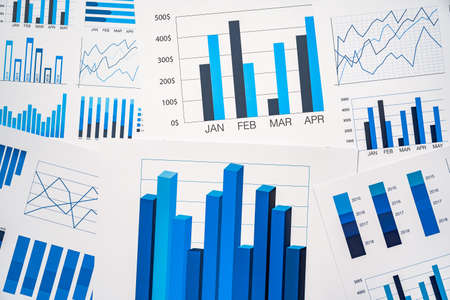
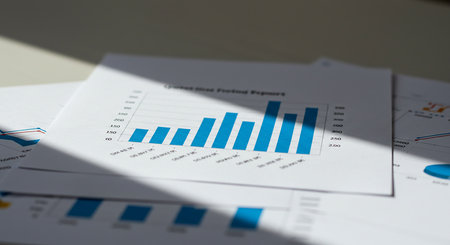
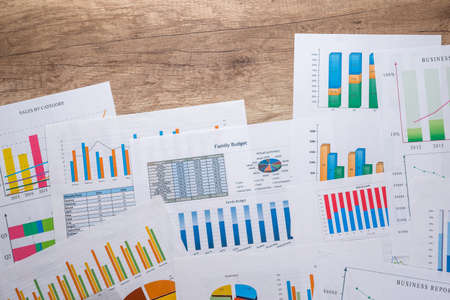
Charts Graphs paper. Financial development, Banking Account, Statistics, Investment Analytic research data economy, Stock exchange Business office company meeting concept.
Коллекция по умолчанию
Коллекция по умолчанию
Создать новую

Close-up of colorful bar chart on wooden table in coffee shop
Коллекция по умолчанию
Коллекция по умолчанию
Создать новую

Sales growth and development illustrated on a graph
Коллекция по умолчанию
Коллекция по умолчанию
Создать новую
This image features colorful 3D bars in varying heights, representing growth and statistical data. Ideal for business presentations or educational materials.
Коллекция по умолчанию
Коллекция по умолчанию
Создать новую

interest rates text and graph showing cost of financing going up next real estate value going down, concept of the global economy after the covid-19 pandemic
Коллекция по умолчанию
Коллекция по умолчанию
Создать новую

Child's hand arranging wood blocks in a step stair concept. Concept for growth, strategy, success process or investment goals.
Коллекция по умолчанию
Коллекция по умолчанию
Создать новую
financial charts and graphs on the table of the businessman, business concept
Коллекция по умолчанию
Коллекция по умолчанию
Создать новую
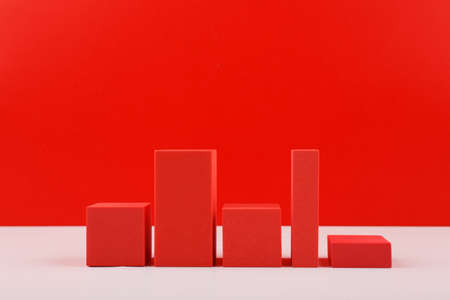
Creative business concept. Red graph diagram or perfomance chart with rise and fall dynamic against red background with copy space. Chart for marketing, annual or corporate report or profit growing
Коллекция по умолчанию
Коллекция по умолчанию
Создать новую

colorful, five rainbow colored sponges on blue background
Коллекция по умолчанию
Коллекция по умолчанию
Создать новую
A bar chart with horizontal bars indicating values for different categories AI generated
Коллекция по умолчанию
Коллекция по умолчанию
Создать новую
A bar graph comparing quarterly profits, highlighted with vibrant colors, on a presentation slide.
Коллекция по умолчанию
Коллекция по умолчанию
Создать новую
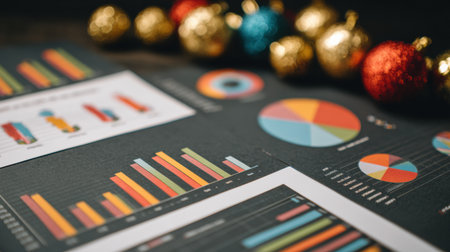
Charts and graphs display data insights on a table, while vibrant holiday ornaments add a festive touch to the workspace, creating a cheerful atmosphere.
Коллекция по умолчанию
Коллекция по умолчанию
Создать новую

A colorful D bar graph rising dramatically on a reflective surface, symbolizing growth and success in business performance metrics.
Коллекция по умолчанию
Коллекция по умолчанию
Создать новую

A pattern of varied multicolored 3d bar charts on small wooden bases, scattered repetitively in varied arrangements on a white background.
Коллекция по умолчанию
Коллекция по умолчанию
Создать новую
A colorful chart with many different colored bars and lines. The chart is titled Trends in the Stock Market
Коллекция по умолчанию
Коллекция по умолчанию
Создать новую
Colorful bar graphs display data trends in a modern and vibrant style, perfect for technology and business presentations or analytics projects.
Коллекция по умолчанию
Коллекция по умолчанию
Создать новую

Business plan documents and charts for eco-tourism startup on rustic wooden table
Коллекция по умолчанию
Коллекция по умолчанию
Создать новую
Monthly percentage bar chart showing financial comparison of 2026 budget versus actual performance data displayed on digital screen. Results tracking.
Коллекция по умолчанию
Коллекция по умолчанию
Создать новую
This abstract image features colorful bars representing data visualization, ideal for business and finance concepts, analytics presentations, and digital design projects.
Коллекция по умолчанию
Коллекция по умолчанию
Создать новую
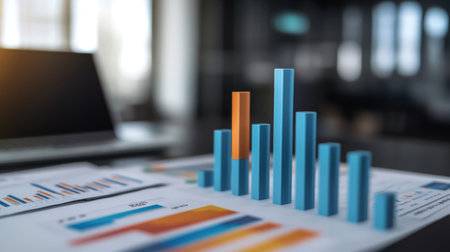
This image features a striking 3D bar graph in a modern office setting, highlighting colorful data points for effective business analysis and planning.
Коллекция по умолчанию
Коллекция по умолчанию
Создать новую

A colorful bar graph displayed on a table highlights data analysis in a modern office setting. Ideal for business and finance presentations.
Коллекция по умолчанию
Коллекция по умолчанию
Создать новую

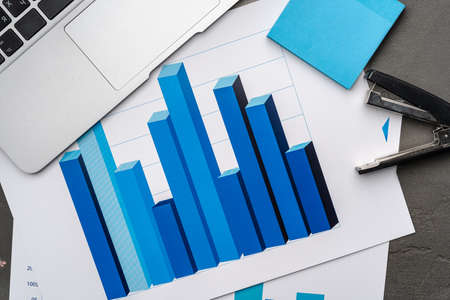
Business charts. Company financial report. Goal for business, bank, finance, investment, money. Quarterly report concept. Blue bar chart. Blue banner with copy space.
Коллекция по умолчанию
Коллекция по умолчанию
Создать новую

A colorful bar graph displays data analysis with a blurred background. This image symbolizes business growth and statistics, perfect for finance and marketing themes.
Коллекция по умолчанию
Коллекция по умолчанию
Создать новую

Bar chart with clean lines and bold colors illustrating sales growth on a digital device
Коллекция по умолчанию
Коллекция по умолчанию
Создать новую

A colorful 3D bar graph rising dramatically on a reflective surface, symbolizing growth and success in business performance metrics.
Коллекция по умолчанию
Коллекция по умолчанию
Создать новую
A minimalist financial bar graph with pastel-colored bars, showing quarterly revenue, displayed on a clean white background with simple grid lines and clear labels.
Коллекция по умолчанию
Коллекция по умолчанию
Создать новую
A close-up view of colorful charts and graphs representing business growth and analysis. Ideal for finance, marketing, and business presentations.
Коллекция по умолчанию
Коллекция по умолчанию
Создать новую
Vibrant data charts and graphs on paper showcase various trends and insights ideal for business analysis, presentations, and financial reports.
Коллекция по умолчанию
Коллекция по умолчанию
Создать новую
Closeup, graphs and screen with data analysis, information and market research with financial
Коллекция по умолчанию
Коллекция по умолчанию
Создать новую
many different business graph with calculator and pen on desk.
Коллекция по умолчанию
Коллекция по умолчанию
Создать новую

colorful bar graph pie chart desk pink background
Коллекция по умолчанию
Коллекция по умолчанию
Создать новую
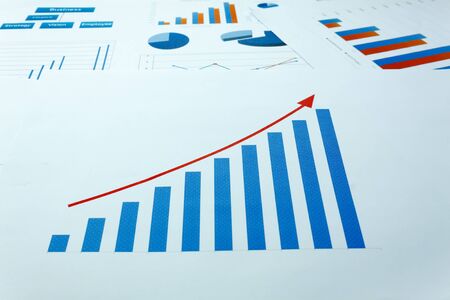
Rising statistics show growing trends and positive data, indicating progress and improvement.
Коллекция по умолчанию
Коллекция по умолчанию
Создать новую

Many type of infographic diagram over white background. Top view.
Коллекция по умолчанию
Коллекция по умолчанию
Создать новую

A striking arrangement of colorful geometric blocks creates a vibrant visual experience. Reflections on the surface enhance the artistic composition with soft lighting.
Коллекция по умолчанию
Коллекция по умолчанию
Создать новую
three dimensional mockup charts showing financial data and business growth
Коллекция по умолчанию
Коллекция по умолчанию
Создать новую
Coronavirus virus covid-19 chart, crisis, economy down, 2019-ncov graph epidemic
Коллекция по умолчанию
Коллекция по умолчанию
Создать новую
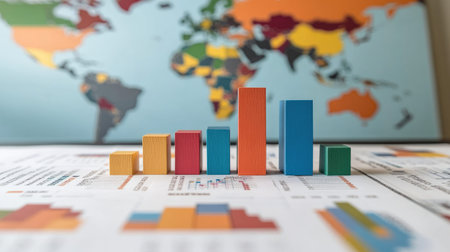
A vivid bar graph with distinct colors stands over business reports, highlighting global market trends against a world map background perfect for analysis.
Коллекция по умолчанию
Коллекция по умолчанию
Создать новую
Colorful wooden blocks stacking as step stair. Business growth concept.
Коллекция по умолчанию
Коллекция по умолчанию
Создать новую
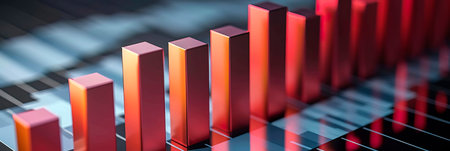
Diagram in volumetric style, business growth, where increasing levels indicate progress.
Коллекция по умолчанию
Коллекция по умолчанию
Создать новую
Printed graphs and laptop on dark gray surface
Коллекция по умолчанию
Коллекция по умолчанию
Создать новую
Close up of business graph analysis document
Коллекция по умолчанию
Коллекция по умолчанию
Создать новую
An engaging D bar graph illustrating market trends, with detailed textures on the bars and a gradient color scheme that enhances the visual impact of the data.
Коллекция по умолчанию
Коллекция по умолчанию
Создать новую
A bar graph comparing quarterly profits, highlighted with vibrant colors, on a presentation slide.
Коллекция по умолчанию
Коллекция по умолчанию
Создать новую
colorful block toys in white isolation background
Коллекция по умолчанию
Коллекция по умолчанию
Создать новую
Colorful bar graph gradually increasing, symbolizing growing statistics
Коллекция по умолчанию
Коллекция по умолчанию
Создать новую

Analysis of data from graphs. select focus.
Коллекция по умолчанию
Коллекция по умолчанию
Создать новую
A vibrant collection of colorful bars represents a bar graph on a wooden table, symbolizing data analysis and business growth concepts in a creative way.
Коллекция по умолчанию
Коллекция по умолчанию
Создать новую
A vibrant bar chart model on a rustic wooden table, ideal for illustrating data analysis and business statistics in a creative workspace environment.
Коллекция по умолчанию
Коллекция по умолчанию
Создать новую

A vivid and colorful data visualization showcasing dynamic bars representing percentages, ideal for reports or presentations in business and analytics.
Коллекция по умолчанию
Коллекция по умолчанию
Создать новую

This image features a trio of black blocks arranged vertically against a vibrant, colorful background. The blurred gradient creates a dynamic art piece suitable for various themes like business growth or creative inspiration.
Коллекция по умолчанию
Коллекция по умолчанию
Создать новую
Financial paper with charts and diagrams on gray table
Коллекция по умолчанию
Коллекция по умолчанию
Создать новую
Set of business card templates with colorful graphs and charts. Vector illustration.
Коллекция по умолчанию
Коллекция по умолчанию
Создать новую
Color palettes and data analysis being presented on a wall in a creative agency
Коллекция по умолчанию
Коллекция по умолчанию
Создать новую

A vibrant bar graph with colorful elements against a dark background, representing data analysis and visualization. Ideal for business and tech themes.
Коллекция по умолчанию
Коллекция по умолчанию
Создать новую
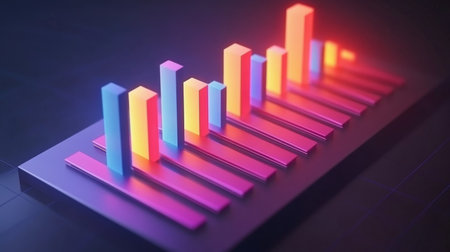
This vibrant 3D bar graph showcases colorful bars in neon hues, ideal for data visualization and analysis in modern business presentations and reports.
Коллекция по умолчанию
Коллекция по умолчанию
Создать новую

A vibrant bar graph displayed on a dark background, enhanced by a soft bokeh effect. This image represents data analysis, marketing trends, and innovation in business analytics.
Коллекция по умолчанию
Коллекция по умолчанию
Создать новую
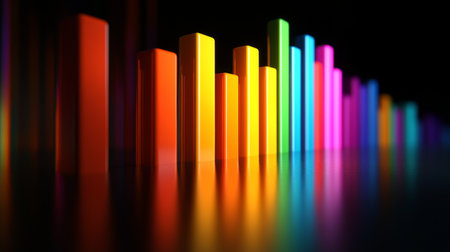
A striking colorful 3D bar graph symbolizing data visualization, ideal for representing analytics, trends, and insights in business and marketing contexts.
Коллекция по умолчанию
Коллекция по умолчанию
Создать новую
Economic growth. Business report. Bar Graph, Chart and Line Graph. Green,red and blue bar graphs on my sample report that print out to show line and chart graphs. Budget and planning report concept.
Коллекция по умолчанию
Коллекция по умолчанию
Создать новую
Clean desk setup for strategic planning with annual growth projection
Коллекция по умолчанию
Коллекция по умолчанию
Создать новую
Legion-Media
Создайте свои проекты на основе качественных стоковых фотографий и видео.


Copyright © Legion-Media.