

Analyzing financial stock market uptrend on subtle background graph for strategic evaluation
Коллекция по умолчанию
Коллекция по умолчанию
Создать новую
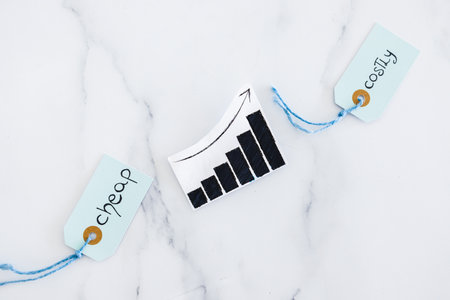
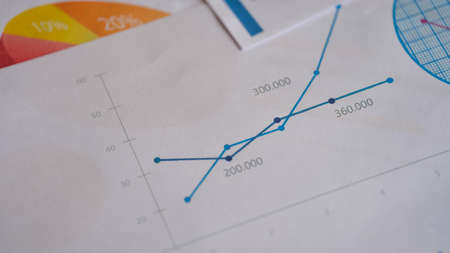
graph showing cost of living going up next to price tags of products going from cheap to costly, inlfation and recession concept after the pandemic
Коллекция по умолчанию
Коллекция по умолчанию
Создать новую

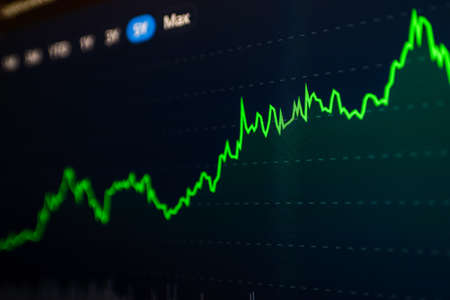
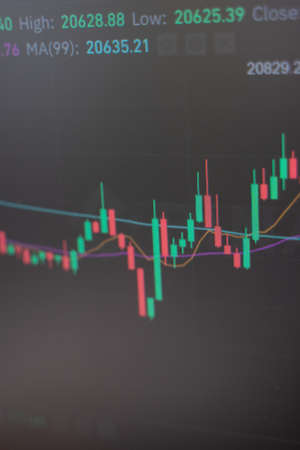
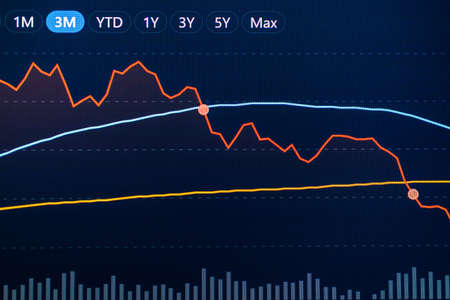
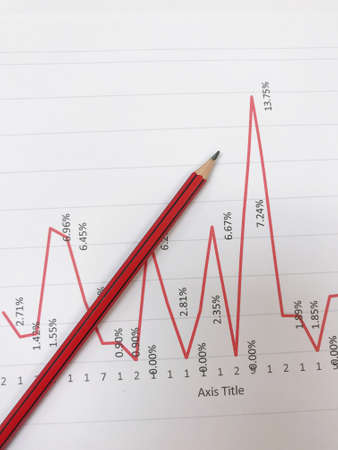
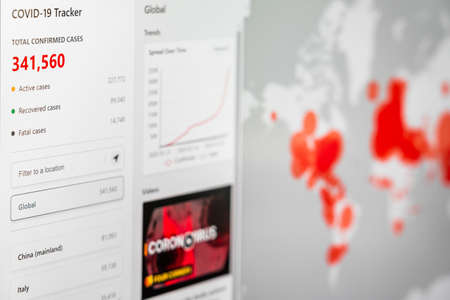
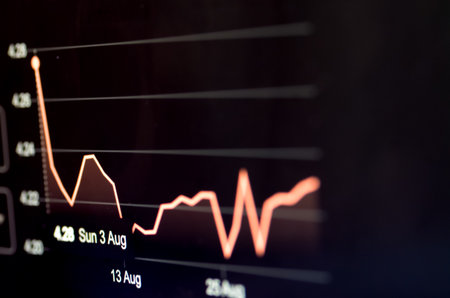
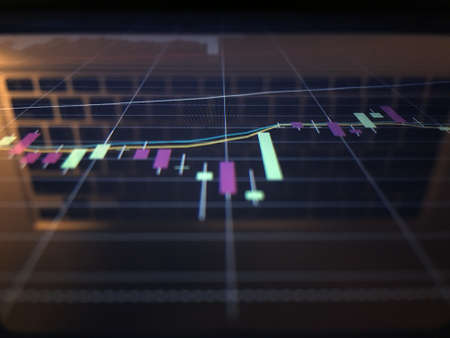
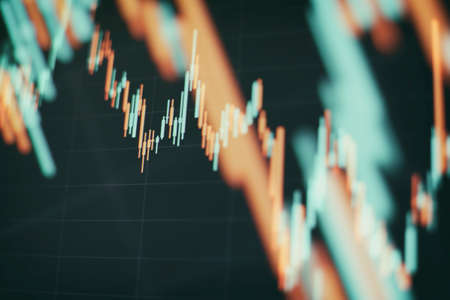
Statistical financial graph predicting an economic depression after a 2020 global coronavirus pandemic.
Коллекция по умолчанию
Коллекция по умолчанию
Создать новую

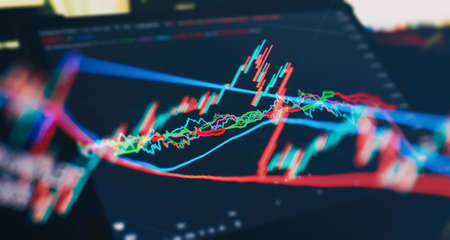
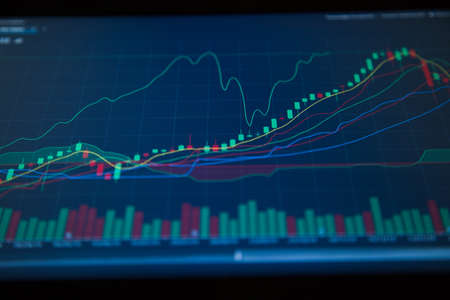
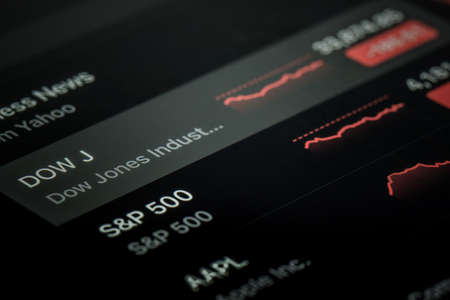
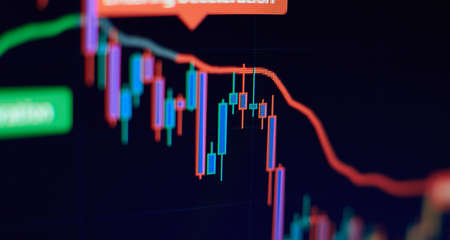
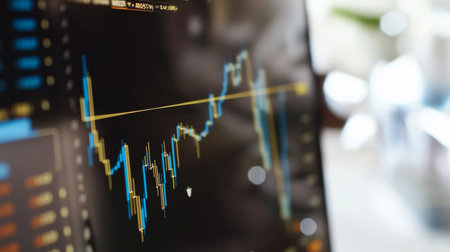
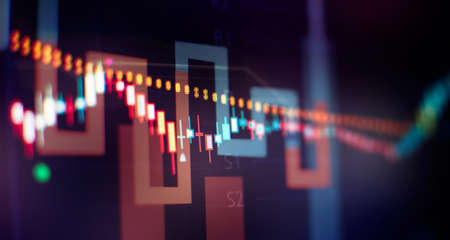
Shallow depth of field (selective focus) with details of a chart showing the stock market crash from March 2020 due to the Covid-19 pandemic on a computer screen (S&P500 index)
Коллекция по умолчанию
Коллекция по умолчанию
Создать новую

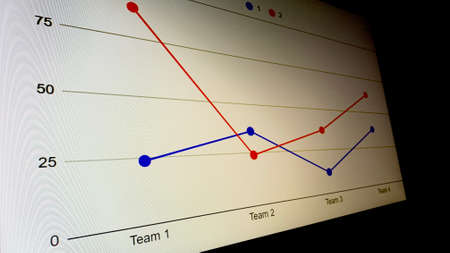
The business plan at the meeting and analyze financial numbers to view the performance of the company.
Коллекция по умолчанию
Коллекция по умолчанию
Создать новую

image is a graph of financial development on a computer monitor.
Коллекция по умолчанию
Коллекция по умолчанию
Создать новую
Business statistics and Analytics value . Abstract glowing forex chart interface background. Investment, trade, stock, finance and analysis concept.
Коллекция по умолчанию
Коллекция по умолчанию
Создать новую

Our profits are on the rise. Shot of paperwork and stationery on a desk in an empty office during the day.
Коллекция по умолчанию
Коллекция по умолчанию
Создать новую

Sales graphs of different colors laid out from candies on gray background
Коллекция по умолчанию
Коллекция по умолчанию
Создать новую
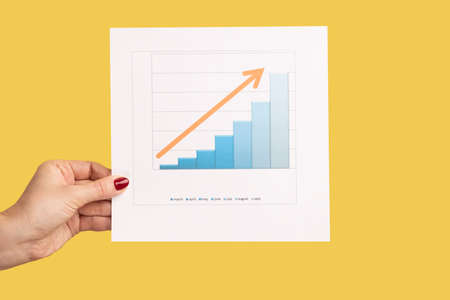
Closeup side view of woman hand holding analyzing graphs and diagrams, statistic. Indoor studio shot isolated on yellow background.
Коллекция по умолчанию
Коллекция по умолчанию
Создать новую

Strategic Insights: A Wooden Canvas of Business Growth Analytics
Коллекция по умолчанию
Коллекция по умолчанию
Создать новую

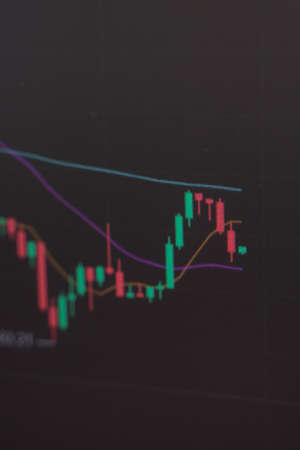
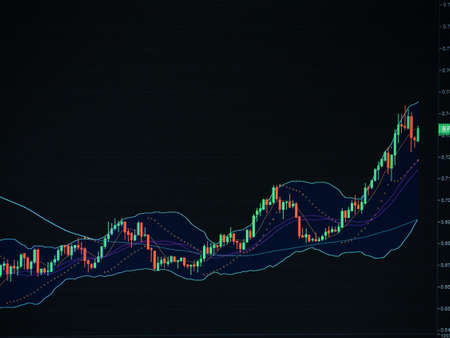
Shallow depth of field (selective focus) with details of a candlestick chart on a computer screen.
Коллекция по умолчанию
Коллекция по умолчанию
Создать новую
Grow Stock market trading graph in graphic concept.financial investment or economic trends business design. Abstract finance background.Low angle shot.
Коллекция по умолчанию
Коллекция по умолчанию
Создать новую

image of the financial graph on a computer monitor.
Коллекция по умолчанию
Коллекция по умолчанию
Создать новую
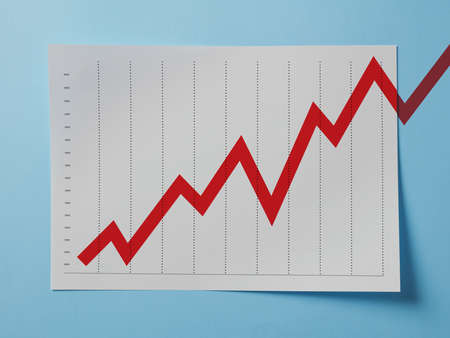
Growing chart on A4 page on blue background
Коллекция по умолчанию
Коллекция по умолчанию
Создать новую
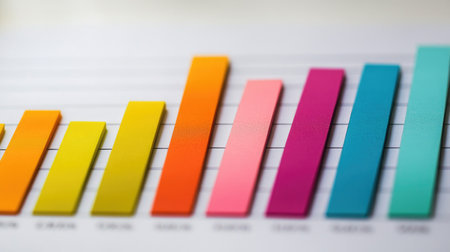
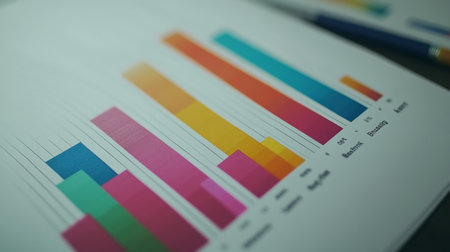
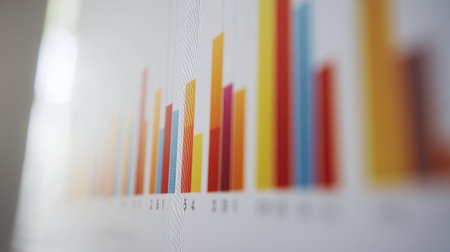
A colorful bar chart representing stock performance over time, with various heights and vibrant colors, set against a clean, professional backdrop.
Коллекция по умолчанию
Коллекция по умолчанию
Создать новую
Stock Market Chart on Blue Background. share drop down and stock up
Коллекция по умолчанию
Коллекция по умолчанию
Создать новую

Minimalistic mixed media collage showcasing business metrics and growth charts
Коллекция по умолчанию
Коллекция по умолчанию
Создать новую
Data financial instruments chart, downtrend stock market analysis report
Коллекция по умолчанию
Коллекция по умолчанию
Создать новую
securities price chart on the monitor screen
Коллекция по умолчанию
Коллекция по умолчанию
Создать новую
Financial graphic chart
Коллекция по умолчанию
Коллекция по умолчанию
Создать новую

close up of pin and hand drawn business strategy graph chart on sticky note with cork board as concept
Коллекция по умолчанию
Коллекция по умолчанию
Создать новую

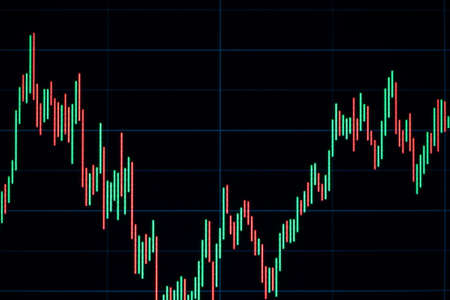
Shallow depth of field (selective focus) with details of a candlestick chart on a computer screen.
Коллекция по умолчанию
Коллекция по умолчанию
Создать новую
Stock Market Trading Chart Investment Analysis Business Index Chart Finance Board Chart
Коллекция по умолчанию
Коллекция по умолчанию
Создать новую
A stock market graph on a black background.
Коллекция по умолчанию
Коллекция по умолчанию
Создать новую
Stock or business market analysis concept. Business financial or stock market background.
Коллекция по умолчанию
Коллекция по умолчанию
Создать новую
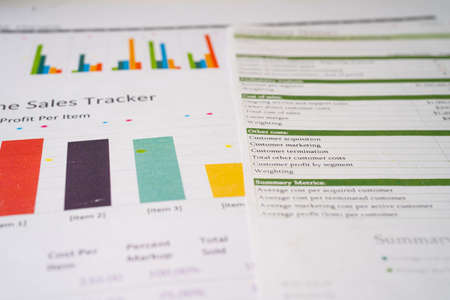
Documents with colourful charts, graphs and diagrams
Коллекция по умолчанию
Коллекция по умолчанию
Создать новую
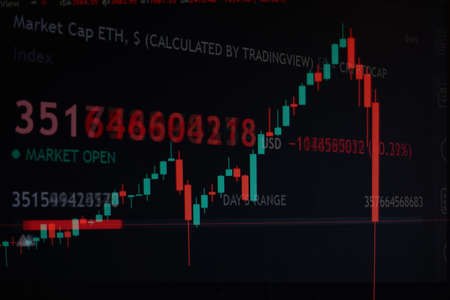
Change the stock market chart. The fall in the value of cryptocurrencies. Brokerage data
Коллекция по умолчанию
Коллекция по умолчанию
Создать новую
Business chart of positive growth on a blackboard
Коллекция по умолчанию
Коллекция по умолчанию
Создать новую

Colorful wine flavor wheel on wooden stand with potted plant in background.
Коллекция по умолчанию
Коллекция по умолчанию
Создать новую
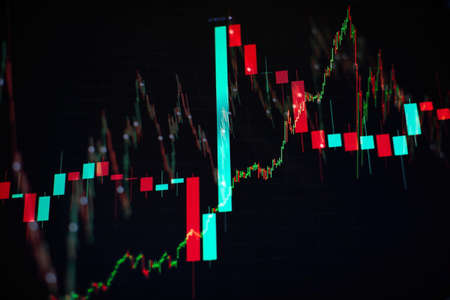
Shallow depth of field (selective focus) with details of a candlestick chart on a computer screen.
Коллекция по умолчанию
Коллекция по умолчанию
Создать новую
Colorful pie chart on a financial report with data visualizations displayed in a business setting in the afternoon
Коллекция по умолчанию
Коллекция по умолчанию
Создать новую

A colorful wooden block with an arrangement of stair or graph.
Коллекция по умолчанию
Коллекция по умолчанию
Создать новую
Hand drawing graph with blue marker. Businessman drawing magnifying arrows oven business graph. Grow.
Коллекция по умолчанию
Коллекция по умолчанию
Создать новую
A visually engaging workspace featuring colorful charts and graphs alongside planters, ideal for presentations, data analysis, and professional brainstorming sessions.
Коллекция по умолчанию
Коллекция по умолчанию
Создать новую

This vibrant flowchart showcases colored markers on graph paper, ideal for creative planning and brainstorming sessions, enhancing organizational skills.
Коллекция по умолчанию
Коллекция по умолчанию
Создать новую
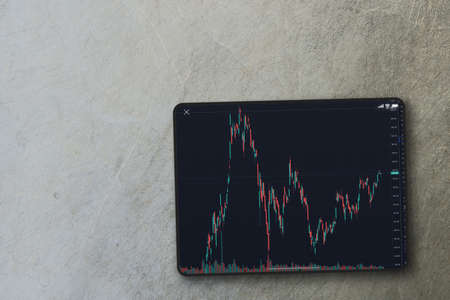
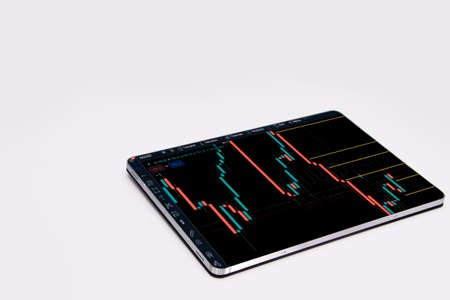
Financial stock market graph on the tablet screen on cement background. Top view. Stock Exchange.
Коллекция по умолчанию
Коллекция по умолчанию
Создать новую
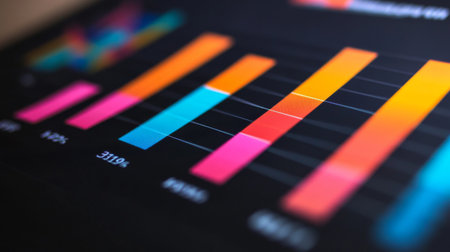
Vibrant bar graph displayed on a digital screen, showcasing data insights and trends for business analysis. Ideal for presentations and reports.
Коллекция по умолчанию
Коллекция по умолчанию
Создать новую
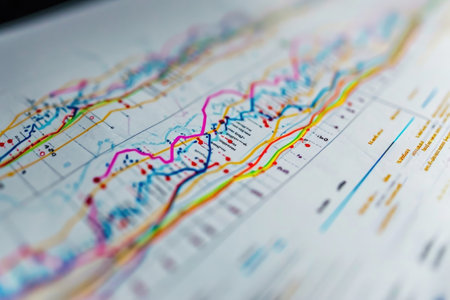
A detailed close-up of a map showcasing numerous intersecting lines, providing information and direction, A graph with detailed lines that shows the increase in inflation over time, AI Generated
Коллекция по умолчанию
Коллекция по умолчанию
Создать новую

A bold red zigzag trend line rests on a smooth marble surface highlighting an upward movement in analysis or design concepts.
Коллекция по умолчанию
Коллекция по умолчанию
Создать новую
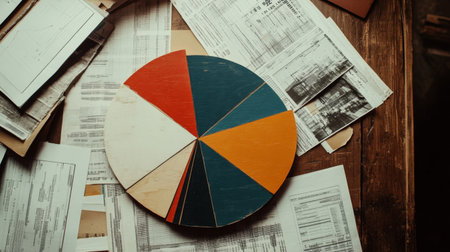
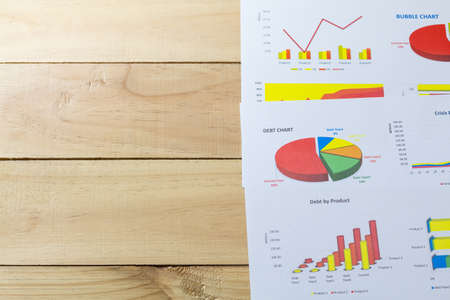
A colorful chart rests on a wooden table surrounded by various documents, showcasing a creative workspace with artistic and analytical elements.
Коллекция по умолчанию
Коллекция по умолчанию
Создать новую
a mahout ride elephant, Chiang Mai, Thailand
Коллекция по умолчанию
Коллекция по умолчанию
Создать новую
Bitcoin. Change the price on the display. Brokerage information, display of the price of the electronic means of payment
Коллекция по умолчанию
Коллекция по умолчанию
Создать новую
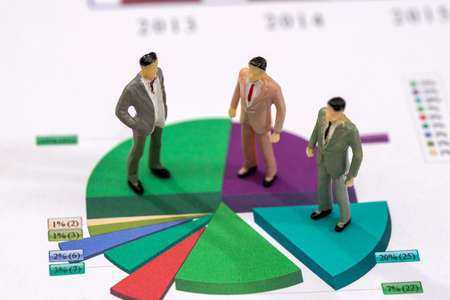
mini people are on the chart
Коллекция по умолчанию
Коллекция по умолчанию
Создать новую
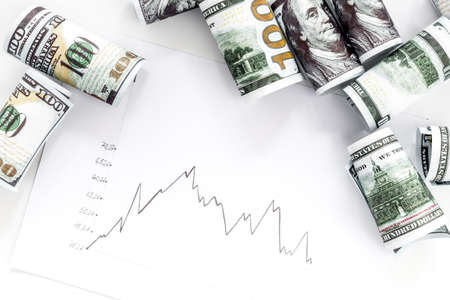
Stock market chart with US dollars banknote top view
Коллекция по умолчанию
Коллекция по умолчанию
Создать новую

Results word on blue. Succeed business success, be a winner in business elections, pop poll or sports test, business report, election result. Counting losses and profit, analyzing financial statistics
Коллекция по умолчанию
Коллекция по умолчанию
Создать новую
A close-up view of a blue and black line graph on a white background, showcasing trends and data analysis essential for business reporting and decision-making.
Коллекция по умолчанию
Коллекция по умолчанию
Создать новую
A financial bar chart showing comparison of investment returns, with green bars rising sharply to symbolize growth, displayed against a white background with grid lines.
Коллекция по умолчанию
Коллекция по умолчанию
Создать новую

Stock Chart Macro Concept 2
Коллекция по умолчанию
Коллекция по умолчанию
Создать новую

Close up image of colored wooden blocks as a graph
Коллекция по умолчанию
Коллекция по умолчанию
Создать новую

Numerical and graphical data simulating a financial study
Коллекция по умолчанию
Коллекция по умолчанию
Создать новую
Abstract graphic consisting of blurred points , graph and chart . information concept.
Коллекция по умолчанию
Коллекция по умолчанию
Создать новую

top view of man hand with pen analyzing bar chart on paper.
Коллекция по умолчанию
Коллекция по умолчанию
Создать новую
Red growth arrow on blue background. Arrow graph going up. The economic growth
Коллекция по умолчанию
Коллекция по умолчанию
Создать новую

Analysis of data from graphs. select focus.
Коллекция по умолчанию
Коллекция по умолчанию
Создать новую
graph with diagrams on the stock market, for business and financial concepts and reports.Abstract blue background.
Коллекция по умолчанию
Коллекция по умолчанию
Создать новую
Stock market trading graph in graphic concept.financial investment or economic trends business design. Abstract finance background.Low angle shot.
Коллекция по умолчанию
Коллекция по умолчанию
Создать новую
A detailed line graph shows financial trends marked by an upward movement, reflecting analysis of data for improved decision-making processes.
Коллекция по умолчанию
Коллекция по умолчанию
Создать новую

Business statistics and Analytics value . Abstract glowing forex chart interface background. Investment, trade, stock, finance and analysis concept.
Коллекция по умолчанию
Коллекция по умолчанию
Создать новую
An office worker shows his colleagues a presentation with a company development graph at night on the company's computer
Коллекция по умолчанию
Коллекция по умолчанию
Создать новую

A vibrant and creative illustration of hand-drawn graphs and arrows on a notebook, showcasing financial analysis and business growth concepts in a warm workspace.
Коллекция по умолчанию
Коллекция по умолчанию
Создать новую
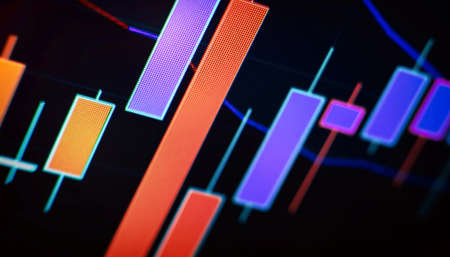
Close up shot on digital screen Candlestick Chart of stock market change and volatility prices profit or loss
Коллекция по умолчанию
Коллекция по умолчанию
Создать новую

chart or graph paper. Financial, account, statistics and business data concept.
Коллекция по умолчанию
Коллекция по умолчанию
Создать новую
Close up of business graph analysis document
Коллекция по умолчанию
Коллекция по умолчанию
Создать новую
The business plan at the meeting and analyze financial numbers to view the performance of the company.
Коллекция по умолчанию
Коллекция по умолчанию
Создать новую

Rainbow lgbtq symbol growth graph with arrow upward on wooden background. Lesbian gay bisexual transgender concept and marketing communication trading making money idea
Коллекция по умолчанию
Коллекция по умолчанию
Создать новую
White simple business drawing on asphalt chalk
Коллекция по умолчанию
Коллекция по умолчанию
Создать новую
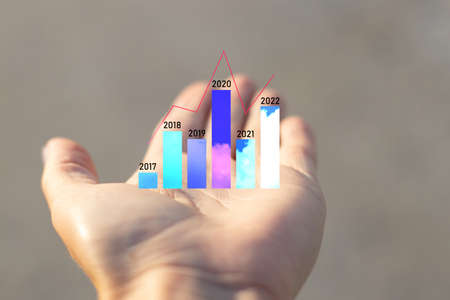
histogram with columns and years in the palm of the hand girl, analysis of years from 2017 to 2022, subview of totals, histogram
Коллекция по умолчанию
Коллекция по умолчанию
Создать новую
Graphs on the Chalkboard - Ascent
Коллекция по умолчанию
Коллекция по умолчанию
Создать новую
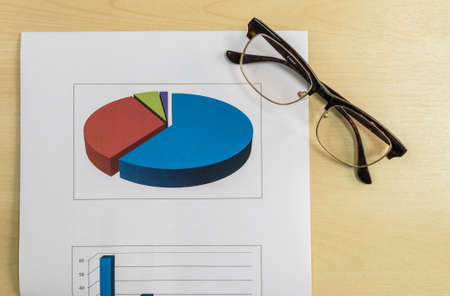
Graph of market share with glasses in business concept
Коллекция по умолчанию
Коллекция по умолчанию
Создать новую
graph paper showing business information, Business graph analysis concept
Коллекция по умолчанию
Коллекция по умолчанию
Создать новую
This image showcases a colorful bar graph that visualizes data insights for business analysis. The vibrant colors highlight various metrics and trends.
Коллекция по умолчанию
Коллекция по умолчанию
Создать новую

Grow Your Business 2020 write on white board background. Chart or mechanism concept
Коллекция по умолчанию
Коллекция по умолчанию
Создать новую
Stock Market Loss Trading Chart Investment Analysis Business Index Chart Finance Board Chart
Коллекция по умолчанию
Коллекция по умолчанию
Создать новую
BUCHAREST, ROMANIA - MARCH 23, 2020: Coronavirus Total Cases Of The Pandemic Spreading All Around The Globe In March
Коллекция по умолчанию
Коллекция по умолчанию
Создать новую

Wooden block statistics histogram with graph showing growth trend on blue paper background
Коллекция по умолчанию
Коллекция по умолчанию
Создать новую
Close-up of a financial graph on a computer screen, showcasing upward and downward trends with detailed line and bar charts.
Коллекция по умолчанию
Коллекция по умолчанию
Создать новую

arrangement of ice cream sticks color with blue background
Коллекция по умолчанию
Коллекция по умолчанию
Создать новую
A close-up of a vertical bar chart with varying heights of bars, highlighting trends and comparisons between different data sets with a clean, white background
Коллекция по умолчанию
Коллекция по умолчанию
Создать новую
Charts Graphs paper. Financial development, Banking Account, Statistics, Investment Analytic research data economy, Stock exchange Business office company meeting concept.
Коллекция по умолчанию
Коллекция по умолчанию
Создать новую

business analysis and statistics concept, desk with mixed graphs and charts on clipboard
Коллекция по умолчанию
Коллекция по умолчанию
Создать новую
Digital Finance: Analyzing Volatile Market Graphs and Managing Tiered Compensation Schedules on a Desktop.
Коллекция по умолчанию
Коллекция по умолчанию
Создать новую
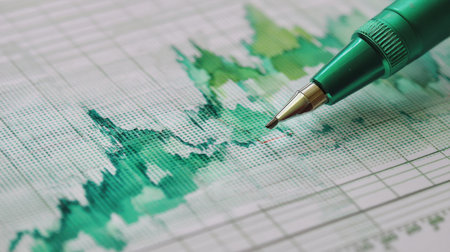
Green pen on financial chart showing data trends and analysis, representing investment growth and market fluctuations, ideal for business and finance themes
Коллекция по умолчанию
Коллекция по умолчанию
Создать новую
Waiting commuter wearing dark coat on night station platform, oncoming headlights. Urban, transit, public, transportation, night
Коллекция по умолчанию
Коллекция по умолчанию
Создать новую
Business or Financial Reference: Displaying stock market data, stock exchange or chart on a monitor, stock market chart, stock exchange or chart. stock market investment trading chart.
Коллекция по умолчанию
Коллекция по умолчанию
Создать новую
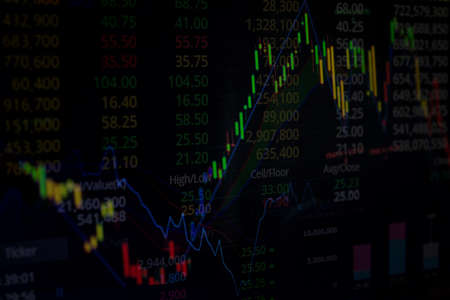
Economic graphic. Financial chart, stock analysis data for business background in digital screen. Graphics growth forex finance market. Stock analyzing. Price chart bars
Коллекция по умолчанию
Коллекция по умолчанию
Создать новую

Creative drawing of business data analysis growth
Коллекция по умолчанию
Коллекция по умолчанию
Создать новую
Business graph. Bullish Bearish trend. Candlestick chart uptrend downtrend . Stock trade on online market forex.
Коллекция по умолчанию
Коллекция по умолчанию
Создать новую
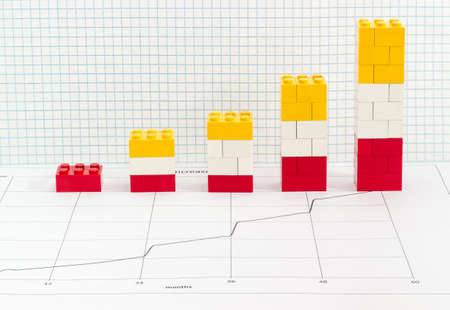
Stacked bar chart with bars which are made from colored plastic parts children's designer on the sheet with line chart against background of squared paper
Коллекция по умолчанию
Коллекция по умолчанию
Создать новую
Thailand Stock Exchange, Trading screen, Stock market.
Коллекция по умолчанию
Коллекция по умолчанию
Создать новую
Tablet Index, Exchange Trading Forex Finance Graphic Concept
Коллекция по умолчанию
Коллекция по умолчанию
Создать новую

Vibrant abstract line graph symbolizes data growth and trends. The colorful lines on a gradient background highlight modern analytics and business performance.
Коллекция по умолчанию
Коллекция по умолчанию
Создать новую

Business chart with line graph, bar chart and numbers on dark background, 3d rendering. Computer digital drawing.
Коллекция по умолчанию
Коллекция по умолчанию
Создать новую

A trader investor analyzes candlestick charts of stocks, crypto currencies in a smartphone application. Trading, investing and technical analysis concept. Close-up of a smartphone screen. 4k
Коллекция по умолчанию
Коллекция по умолчанию
Создать новую
Analysis for professional technical analysis on the monitor of a computer. Fundamental and technical analysis concept.
Коллекция по умолчанию
Коллекция по умолчанию
Создать новую
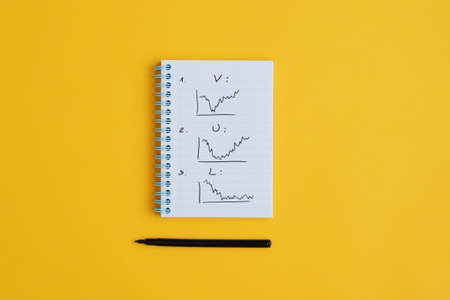
Top view of notepad with different types of recession graphs drawn in it.
Коллекция по умолчанию
Коллекция по умолчанию
Создать новую

Growth graph concept made of colorful button shaped candies over dark blue background. This image is a photograph with a drawing over it.
Коллекция по умолчанию
Коллекция по умолчанию
Создать новую

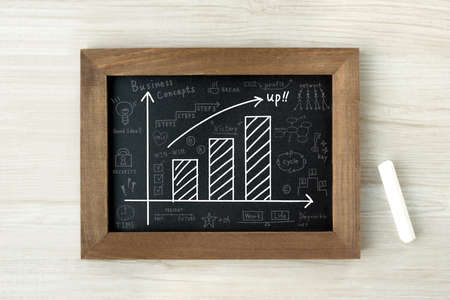
blackboard with frame with a plot of economy
Коллекция по умолчанию
Коллекция по умолчанию
Создать новую
Stock market or forex trading graph in graphic concept suitable for financial investment or Economic trends business idea and all art work design.
Коллекция по умолчанию
Коллекция по умолчанию
Создать новую
Abstract financial graph with candle stick and bar chart of stock market on financial background
Коллекция по умолчанию
Коллекция по умолчанию
Создать новую
Legion-Media
Создайте свои проекты на основе качественных стоковых фотографий и видео.


Copyright © Legion-Media.